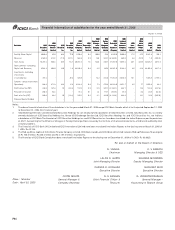
ICICI Bank 2005 Annual Report Download - page 130
Download and view the complete annual report
Please find page 130 of the 2005 ICICI Bank annual report below. You can navigate through the pages in the report by either clicking on the pages listed below, or by using the keyword search tool below to find specific information within the annual report.-
 1
1 -
2
-
3
-
4
-
5
-
6
-
7
-
8
-
9
-
10
-
11
-
12
-
13
-
14
-
15
-
16
-
17
-
18
-
19
-
20
-
21
-
22
-
23
-
24
-
25
-
26
-
27
-
28
-
29
-
30
-
31
-
32
-
33
-
34
-
35
-
36
-
37
-
38
-
39
-
40
-
41
-
42
-
43
-
44
-
45
-
46
-
47
-
48
-
49
-
50
-
51
-
52
-
53
-
54
-
55
-
56
-
57
-
58
-
59
-
60
-
61
-
62
-
63
-
64
-
65
-
66
-
67
-
68
-
69
-
70
-
71
-
72
-
73
-
74
-
75
-
76
-
77
-
78
-
79
-
80
-
81
-
82
-
83
-
84
-
85
-
86
-
87
-
88
-
89
-
90
-
91
-
92
-
93
-
94
-
95
-
96
-
97
-
98
-
99
-
100
-
101
-
102
-
103
-
104
-
105
-
106
-
107
-
108
-
109
-
110
-
111
-
112
-
113
-
114
-
115
-
116
-
117
-
118
-
119
-
 120
120 -
 121
121 -
 122
122 -
 123
123 -
 124
124 -
 125
125 -
 126
126 -
 127
127 -
 128
128 -
 129
129 -
 130
130 -
 131
131 -
 132
132
 |
 |

F70
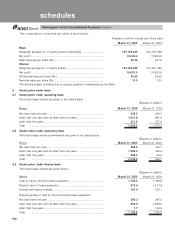
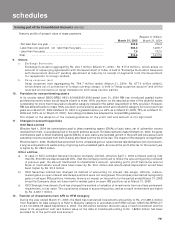
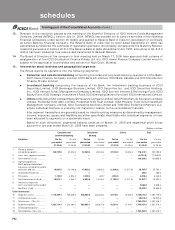
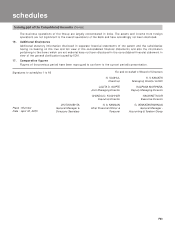
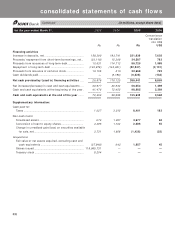
Continued (in millions, except share data)
consolidated statements of cash flows
Convenience
translation
into US$
Rs. Rs. Rs. US$
for the year ended March 31, 2003 2004 2005 2005
Financing activities
Increase in deposits, net ..................................................... 158,290 193,741 331,636 7,603
Proceeds/ repayment from short-term borrowings, net .. (30,118) 15,269 34,587 793
Proceeds from issuances of long-term debt ..................... 10,631 114,712 86,725 1,988
Repayment of long-term debt ............................................ (124,979) (142,931) (92,947) (2,131)
Proceeds from issuance of common stock....................... 13,155 515 32,668 749
Cash dividends paid............................................................. — (5,186) (6,228) (143)
Net cash provided by/(used in) financing activities .... 26,979 176,120 386,441 8,859
Net increase/(decrease) in cash and cash equivalents .... 30,977 26,532 56,654 1,299
Cash and cash equivalents at the beginning of the year. 41,476 72,453 98,985 2,269
Cash and cash equivalents at the end of the year ....... 72,453 98,985 155,639 3,568
Supplementary information:
Cash paid for:
Taxes ................................................................................. 1,027 3,313 8,401 193
Non-cash items:
Foreclosed assets............................................................ 673 1,087 3,677 84
Conversion of loan to equity shares .............................. 4,495 1,162 2,385 55
Change in unrealized gain/(loss) on securities available
for sale, net................................................................... 3,731 1,858 (1,426) (33)
Acquisitions
Fair value of net assets acquired, excluding cash and
cash equivalents .......................................................... (37,948) 642 1,957 45
Shares issued................................................................... 118,965,731 — ——
Treasury stock .................................................................. 8,204 — ——