ICICI Bank 2005 Annual Report Download - page 47
Download and view the complete annual report
Please find page 47 of the 2005 ICICI Bank annual report below. You can navigate through the pages in the report by either clicking on the pages listed below, or by using the keyword search tool below to find specific information within the annual report.-
 1
1 -
2
-
3
-
4
-
5
-
6
-
7
-
8
-
9
-
10
-
11
-
12
-
13
-
14
-
15
-
16
-
17
-
18
-
19
-
20
-
21
-
22
-
23
-
24
-
25
-
26
-
27
-
28
-
29
-
30
-
31
-
32
-
33
-
34
-
35
-
36
-
 37
37 -
 38
38 -
 39
39 -
 40
40 -
 41
41 -
 42
42 -
 43
43 -
 44
44 -
 45
45 -
 46
46 -
 47
47 -
 48
48 -
 49
49 -
 50
50 -
 51
51 -
 52
52 -
 53
53 -
 54
54 -
 55
55 -
 56
56 -
 57
57 -
58
-
59
-
60
-
61
-
62
-
63
-
64
-
65
-
66
-
67
-
68
-
69
-
70
-
71
-
72
-
73
-
74
-
75
-
76
-
77
-
78
-
79
-
80
-
81
-
82
-
83
-
84
-
85
-
86
-
87
-
88
-
89
-
90
-
91
-
92
-
93
-
94
-
95
-
96
-
97
-
98
-
99
-
100
-
101
-
102
-
103
-
104
-
105
-
106
-
107
-
108
-
109
-
110
-
111
-
112
-
113
-
114
-
115
-
116
-
117
-
118
-
119
-
120
-
121
-
122
-
123
-
124
-
125
-
126
-
127
-
128
-
129
-
130
-
131
-
132
 |
 |
45
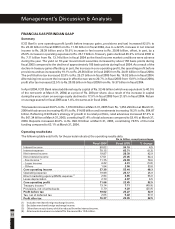
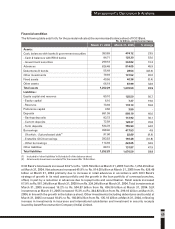
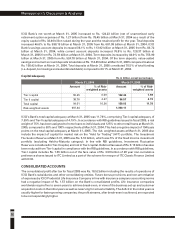
Key ratios
The following table sets forth, for the periods indicated, the key ratios.
(1) Return on assets is based on average daily assets.
(2) Cost includes operating expense excluding DMA expense and lease depreciation. Total income includes net interest
income and non-interest income and is net of lease depreciation.
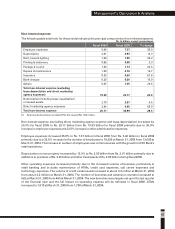
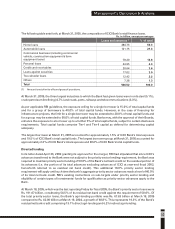
Net interest income and spread analysis
The following table sets forth, for the periods indicated, the net interest income and spread analysis.
(1) Excludes dividend income.
(2) All amounts have been rounded off to the nearest Rs. 10.0 million.
Net interest income increased 42.9% to Rs. 28.39 billion in fiscal 2005 from Rs. 19.87 billion in fiscal 2004,
reflecting mainly the following:
!an increase of Rs. 173.55 billion or 17.7% in the average volume of interest-earning assets; and
!an increase in the net interest margin to 2.4% in fiscal 2005 from 1.9% in fiscal 2004.
ICICI Bank’s spread is lower than that of other Indian banks due to the high-cost liabilities of erstwhile ICICI
Limited (ICICI) and the maintenance of Statutory Liquidity Ratio (SLR) and Cash Reserve Ratio (CRR) on
these liabilities, which were not subject to these ratios prior to the merger. While ICICI Bank’s cost of
deposits (4.5% in fiscal 2005) is comparable to the cost of deposits of other banks in India, ICICI Bank’s total
cost of funding (5.8% in fiscal 2005) is higher compared to other banks as a result of these high-cost
liabilities. Further, ICICI Bank has to maintain SLR and CRR on these liabilities, resulting in a negative impact
on the spread.
The average volume of interest-earning assets increased by Rs. 173.55 billion during fiscal 2005 primarily
due to the increase in average advances by Rs. 152.75 billion, and increase in average investments and
other interest-earning assets by Rs. 20.80 billion. The increase in the average advances was mainly due to
increased disbursements of retail finance loans as well as increase in the loan portfolio of overseas
branches, offset, in part, by securitisation of loans and repayment of existing loans. Retail advances
increased by 67.9% to Rs. 561.34 billion at March 31, 2005 from Rs. 334.24 billion at March 31, 2004.
Management’s Discussion & Analysis
Return on equity (%)
(1)
Return on assets (%)
Earnings per share (Rs.)
Book value (Rs.)
Fee to income (%)
(2)
Cost to income (%)
Fiscal 2005
17.9
1.4
27.6
168.6
35.2
42.2
Fiscal 2004
21.8
1.4
26.7
127.3
24.6
41.9
Average interest-earning assets
Average interest-bearing liabilities
(1)
Net interest margin
(1)
Average yield
Average cost of funds
(1)
Spread
% change
17.7
15.0
-
-
-
-
Fiscal 2005
1,153.24
1,138.25
2.4%
8.1%
5.8%
2.3%
Fiscal 2004
979.69
989.66
1.9%
9.1%
7.1%
2.0%
Rs. in billion, except percentages
Dickenson Tel: 022-2625 2282