Volvo 2010 Annual Report Download - page 99
Download and view the complete annual report
Please find page 99 of the 2010 Volvo annual report below. You can navigate through the pages in the report by either clicking on the pages listed below, or by using the keyword search tool below to find specific information within the annual report.-
 1
1 -
2
-
3
-
4
-
5
-
6
-
7
-
8
-
9
-
10
-
11
-
12
-
13
-
14
-
15
-
16
-
17
-
18
-
19
-
20
-
21
-
22
-
23
-
24
-
25
-
26
-
27
-
28
-
29
-
30
-
31
-
32
-
33
-
34
-
35
-
36
-
37
-
38
-
39
-
40
-
41
-
42
-
43
-
44
-
45
-
46
-
47
-
48
-
49
-
50
-
51
-
52
-
53
-
54
-
55
-
56
-
57
-
58
-
59
-
60
-
61
-
62
-
63
-
64
-
65
-
66
-
67
-
68
-
69
-
70
-
71
-
72
-
73
-
74
-
75
-
76
-
77
-
78
-
79
-
80
-
81
-
82
-
83
-
84
-
85
-
86
-
87
-
88
-
 89
89 -
 90
90 -
 91
91 -
 92
92 -
 93
93 -
 94
94 -
 95
95 -
 96
96 -
 97
97 -
 98
98 -
 99
99 -
 100
100 -
 101
101 -
 102
102 -
 103
103 -
 104
104 -
 105
105 -
 106
106 -
 107
107 -
 108
108 -
 109
109 -
110
-
111
-
112
-
113
-
114
-
115
-
116
-
117
-
118
-
119
-
120
-
121
-
122
-
123
-
124
-
125
-
126
-
127
-
128
-
129
-
130
-
131
-
132
-
133
-
134
-
135
-
136
-
137
-
138
-
139
-
140
-
141
-
142
-
143
-
144
-
145
-
146
-
147
-
148
-
149
-
150
-
151
-
152
-
153
-
154
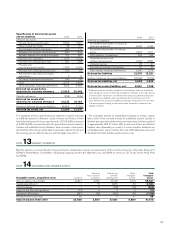
 |
 |

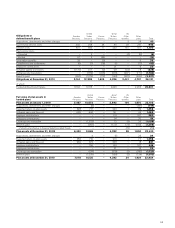
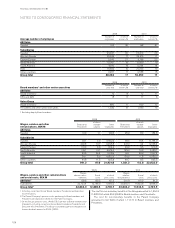
Fair value of plan assets in
funded plans Sweden
Pensions
United
States
Pensions
France
Pensions
Great
Britain
Pensions
US
Other
benefits
Other
plans Total
Plan assets at January 1, 2009 5,467 10,672 – 3,992 104 1,870 22,105
Acquisitions, divestments and other changes – (3) – – – (141) (144)
Expected return on plan assets 328 717 – 223 1 89 1,358
Actuarial gains and (losses) 635 644 – 141 – 43 1,463
Employer contributions – – – 113 – 167 280
Employee contributions – – – 24 – 20 44
Exchange rate translation – (1,203) – 72 (3) 36 (1,098)
Benefits paid – (961) – (173) (74) (190) (1,398)
of which reclassification to financial liability in Mack Trucks – – – – (73) –(73)
Plan assets at December 31, 2009 6,430 9,866 – 4,392 28 1,894 22,610
Acquisitions, divestments and other changes – 4 – (1) – 26 29
Expected return on plan assets 386 719 – 216 – 77 1,398
Actuarial gains and (losses) 262 373 – 208 – 18 861
Employer contributions – 156 – 103 – 187 446
Employee contributions – – – 21 – 12 33
Exchange rate translation – (574) – (378) (2) (166) (1,120)
Benefits paid – (1,009) – (168) (2) (124) (1,303)
Plan assets at December 31, 2010 7,078 9,535 – 4,393 24 1,924 22,954
Obligations in
defined benefit plans Sweden
Pensions
United
States
Pensions
France
Pensions
Great
Britain
Pensions
US
Other
benefits
Other
plans Total
Acquisitions, divestments and other changes – 10 – – 2 28 40
Current year service costs 302 258 54 45 39 247 945
Interest costs 401 665 77 233 167 157 1,700
Past service costs
– Unvested – 3 – – (4) (5) (6)
– Vested 27 3 (44) – – – (14)
Termination benefits 33 – (2) – – 5 36
Curtailments and settlements (6) (7) (18) (1) – (11) (43)
Employee contributions – – – 21 – 9 30
Actuarial (gains) and losses (1,170) 571 (2) 28 (33) 78 (528)
Exchange rate translation – (789) (245) (370) (207) (171) (1,782)
Benefits paid (324) (1,074) (112) (168) (220) (429) (2,327)
Obligations at December 31, 2010 9,144 12,998 1,605 4,226 3,441 4,707 36,121
of which
Funded defined-benefit plans 8,794 11,378 – 4,226 – 2,203 26,601
95