Volvo 2010 Annual Report Download - page 67
Download and view the complete annual report
Please find page 67 of the 2010 Volvo annual report below. You can navigate through the pages in the report by either clicking on the pages listed below, or by using the keyword search tool below to find specific information within the annual report.-
 1
1 -
2
-
3
-
4
-
5
-
6
-
7
-
8
-
9
-
10
-
11
-
12
-
13
-
14
-
15
-
16
-
17
-
18
-
19
-
20
-
21
-
22
-
23
-
24
-
25
-
26
-
27
-
28
-
29
-
30
-
31
-
32
-
33
-
34
-
35
-
36
-
37
-
38
-
39
-
40
-
41
-
42
-
43
-
44
-
45
-
46
-
47
-
48
-
49
-
50
-
51
-
52
-
53
-
54
-
55
-
56
-
 57
57 -
 58
58 -
 59
59 -
 60
60 -
 61
61 -
 62
62 -
 63
63 -
 64
64 -
 65
65 -
 66
66 -
 67
67 -
 68
68 -
 69
69 -
 70
70 -
 71
71 -
 72
72 -
 73
73 -
 74
74 -
 75
75 -
 76
76 -
 77
77 -
78
-
79
-
80
-
81
-
82
-
83
-
84
-
85
-
86
-
87
-
88
-
89
-
90
-
91
-
92
-
93
-
94
-
95
-
96
-
97
-
98
-
99
-
100
-
101
-
102
-
103
-
104
-
105
-
106
-
107
-
108
-
109
-
110
-
111
-
112
-
113
-
114
-
115
-
116
-
117
-
118
-
119
-
120
-
121
-
122
-
123
-
124
-
125
-
126
-
127
-
128
-
129
-
130
-
131
-
132
-
133
-
134
-
135
-
136
-
137
-
138
-
139
-
140
-
141
-
142
-
143
-
144
-
145
-
146
-
147
-
148
-
149
-
150
-
151
-
152
-
153
-
154
 |
 |

Balance Sheets Volvo Group
Industrial Operations Customer Finance Eliminations Volvo Group
SEK M
Dec 31
2009
Dec 31
2010
Dec 31
2009
Dec 31
2010
Dec 31
2009
Dec 31
2010
Dec 31
2009
Dec 31
2010
Assets
Non-current assets
Intangible assets 41,532 40,613 96 101 0 0 41,628 40,714
Tangible assets
Property, plant and equipment 55,208 54,169 72 72 0 0 55,280 54,242
Assets under operating leases 13,539 13,217 10,955 10,055 (4,106) (3,625) 20,388 19,647
Financial assets
Shares and participation 2,025 2,080 19 18 0 0 2,044 2,098
Non-current customer-financing receivables 531 598 39,720 36,270 (538) (843) 39,713 36,025
Deferred tax assets 12,277 12,019 318 291 0 0 12,595 12,310
Prepaid pensions 2,038 1,636 10 12 0 0 2,049 1,648
Non-current interest-bearing receivables 1,095 941 0 204 (510) (379) 585 766
Other non-current receivables 3,033 3,401 42 41 (36) (24) 3,038 3,418
Total non-current assets 131,278 128,674 51,232 47,064 (5,190) (4,871) 177,320 170,868
Current assets
Inventories 35,765 38,956 1,962 882 0 0 37,727 39,837
Current receivables
Customer-financing receivables 836 830 42,443 36,897 (1,015) (1,064) 42,264 36,663
Tax assets 1,362 1,045 161 90 0 0 1,523 1,135
Interest-bearing receivables 1,215 1,071 66 1,283 (872) (2,012) 410 342
Internal funding 3,662 7,505 0 0 (3,662) (7,505) – –
Accounts receivable 20,877 24,332 460 101 0 0 21,337 24,433
Other receivables 11,459 11,561 1,701 1,352 (1,077) (1,056) 12,082 11,857
Non interest-bearing assets held for sale 1,684 136 – – – – 1,684 136
Interest-bearing assets held for sale 8 0 – – – – 8 0
Marketable securities 16,655 9,735 21 32 0 0 16,676 9,767
Cash and cash equivalents 20,749 21,756 726 1,545 (241) (335) 21,234 22,966
Total current assets 114,272 116,928 47,540 42,182 (6,867) (11,970) 154,945 147,139
Total assets 245,550 245,602 98,772 89,246 (12,057) (16,841) 332,265 318,007
Shareholders’ equity and liabilities
Equity attributable to the equity holders of the Parent Company 57,856 65,090 8,549 8,020 0 0 66,405 73,110
Minority interests 629 1,011 0 0 0 0 629 1,011
Total shareholders’ equity 58,485 66,101 8,549 8,020 0 0 67,034 74,121
Non-current provisions
Provisions for post-employment benefits 8,021 7,478 30 32 0 0 8,051 7,510
Provisions for deferred taxes 1,858 3,026 1,780 1,496 0 0 3,638 4,522
Other provisions 6,277 5,785 80 150 2 1 6,360 5,936
Non-current liabilities
Bond loans 49,191 38,767 0 0 0 0 49,191 38,767
Other loans 48,684 37,180 7,458 8,225 (107) (78) 56,035 45,327
Internal funding (30,908) (26,971) 32,758 25,927 (1,849) 1,044 – –
Other liabilities 11,762 11,172 479 389 (2,353) (2,330) 9,888 9,231
Current provisions 9,321 8,429 164 105 2 1 9,487 8,534
Current liabilities
Loans 44,196 32,101 8,305 8,299 (876) (799) 51,626 39,601
Internal funding (32,273) (21,220) 36,457 33,643 (4,184) (12,423) – –
Non interest-bearing liabilities held for sale 272 135 – – – – 272 135
Trade payables 35,754 47,111 201 139 0 0 35,955 47,250
Tax liabilities 369 1,571 254 161 0 0 623 1,732
Other liabilities 34,541 34,937 2,257 2,660 (2,692) (2,257) 34,105 35,341
Total shareholders’ equity and liabilities 245,550 245,602 98,772 89,246 (12,057) (16,841) 332,265 318,007
Contingent liabilities 9,607 11,003
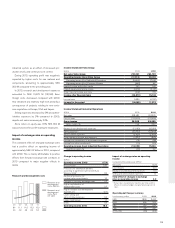
SEK 0.1 billion compared to year-end 2009. Post-
employment benefits valued at SEK 7.3 billion were
reported outside the Volvo Group’s balance sheet.
For further information see Note 24.
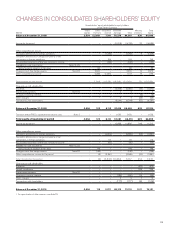
At year-end, the equity ratio in the Industrial
Operations was 26.9% and in the Volvo Group
23.3%. Shareholder’s equity in the Volvo Group
amounted to SEK 74.1 billion at December 31, 2010.
63