Volvo 2010 Annual Report Download - page 45
Download and view the complete annual report
Please find page 45 of the 2010 Volvo annual report below. You can navigate through the pages in the report by either clicking on the pages listed below, or by using the keyword search tool below to find specific information within the annual report.-
 1
1 -
2
-
3
-
4
-
5
-
6
-
7
-
8
-
9
-
10
-
11
-
12
-
13
-
14
-
15
-
16
-
17
-
18
-
19
-
20
-
21
-
22
-
23
-
24
-
25
-
26
-
27
-
28
-
29
-
30
-
31
-
32
-
33
-
34
-
 35
35 -
 36
36 -
 37
37 -
 38
38 -
 39
39 -
 40
40 -
 41
41 -
 42
42 -
 43
43 -
 44
44 -
 45
45 -
 46
46 -
 47
47 -
 48
48 -
 49
49 -
 50
50 -
 51
51 -
 52
52 -
 53
53 -
 54
54 -
 55
55 -
56
-
57
-
58
-
59
-
60
-
61
-
62
-
63
-
64
-
65
-
66
-
67
-
68
-
69
-
70
-
71
-
72
-
73
-
74
-
75
-
76
-
77
-
78
-
79
-
80
-
81
-
82
-
83
-
84
-
85
-
86
-
87
-
88
-
89
-
90
-
91
-
92
-
93
-
94
-
95
-
96
-
97
-
98
-
99
-
100
-
101
-
102
-
103
-
104
-
105
-
106
-
107
-
108
-
109
-
110
-
111
-
112
-
113
-
114
-
115
-
116
-
117
-
118
-
119
-
120
-
121
-
122
-
123
-
124
-
125
-
126
-
127
-
128
-
129
-
130
-
131
-
132
-
133
-
134
-
135
-
136
-
137
-
138
-
139
-
140
-
141
-
142
-
143
-
144
-
145
-
146
-
147
-
148
-
149
-
150
-
151
-
152
-
153
-
154
 |
 |
Outcome 2010
• Re-established positive portfolio trends and maintained strong customer and dealer relationships.
• Improved segmentation analysis and institutionalized best practices across all regions.
• Aligned regional resources and operations to market conditions and rationalized cost structure.
• Executed on capital strategies including asset-backed securitization, syndication and private label
finance programs.
Ambitions 2011
• Achieve profitable growth in all markets.
• Continue to improve operational leverage and efficiency.
• Increase standardization of processes and systems.
• Continue to develop BRIC markets.
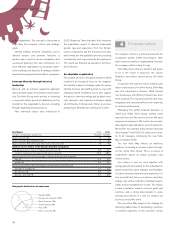
Net sales as per-
centage of Volvo
Group sales
Operating income (loss)
3% (5)
1009080706
167SEK M(680)1,3971,6491,686
30
Volvo
Trucks Renault
Trucks Mack
Trucks Buses Volvo
CE
29 20 17 14 20 16 11 34 35
10
09
%
UD
Trucks
4 12
Penetration1Distribution of credit portfolio
Volvo Trucks 46%
Volvo CE 24%
Renault Trucks 13%
Mack Trucks 8%
Buses 5%
UD Trucks 3%
Other 1%
1 Share of business financed by Volvo Financial Services in
markets where financial services are offered.
167
41