Volvo 2010 Annual Report Download - page 90
Download and view the complete annual report
Please find page 90 of the 2010 Volvo annual report below. You can navigate through the pages in the report by either clicking on the pages listed below, or by using the keyword search tool below to find specific information within the annual report.-
 1
1 -
2
-
3
-
4
-
5
-
6
-
7
-
8
-
9
-
10
-
11
-
12
-
13
-
14
-
15
-
16
-
17
-
18
-
19
-
20
-
21
-
22
-
23
-
24
-
25
-
26
-
27
-
28
-
29
-
30
-
31
-
32
-
33
-
34
-
35
-
36
-
37
-
38
-
39
-
40
-
41
-
42
-
43
-
44
-
45
-
46
-
47
-
48
-
49
-
50
-
51
-
52
-
53
-
54
-
55
-
56
-
57
-
58
-
59
-
60
-
61
-
62
-
63
-
64
-
65
-
66
-
67
-
68
-
69
-
70
-
71
-
72
-
73
-
74
-
75
-
76
-
77
-
78
-
79
-
 80
80 -
 81
81 -
 82
82 -
 83
83 -
 84
84 -
 85
85 -
 86
86 -
 87
87 -
 88
88 -
 89
89 -
 90
90 -
 91
91 -
 92
92 -
 93
93 -
 94
94 -
 95
95 -
 96
96 -
 97
97 -
 98
98 -
 99
99 -
 100
100 -
101
-
102
-
103
-
104
-
105
-
106
-
107
-
108
-
109
-
110
-
111
-
112
-
113
-
114
-
115
-
116
-
117
-
118
-
119
-
120
-
121
-
122
-
123
-
124
-
125
-
126
-
127
-
128
-
129
-
130
-
131
-
132
-
133
-
134
-
135
-
136
-
137
-
138
-
139
-
140
-
141
-
142
-
143
-
144
-
145
-
146
-
147
-
148
-
149
-
150
-
151
-
152
-
153
-
154
 |
 |

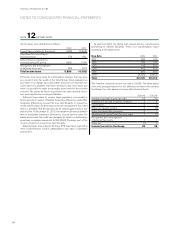
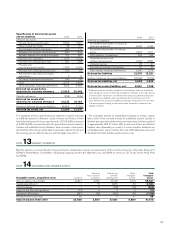
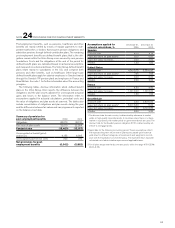
NOTES TO CONSOLIDATED FINANCIAL STATEMENTS
Accumulated depreciation and amortization Goodwill
Entrance
fees, industrial
programs
Product and
software
development
Other
intangible
assets
Total
intangible
assets
Value in balance sheet 2009 – 1,762 13,739 2,398 17,899
Depreciation and amortization6– 59 2,857 389 3,305
Sales/scrapping – 0 (45) (78) (123)
Acquired and divested operations – 0 0 0 0
Translation differences – (1) (285) (84) (370)
Reclassifications and other – 0 5 46 51
Value in balance sheet 2010 – 1,820 16,271 2,671 20,762
Net carrying value in balance sheet 2009423,827 2,071 11,409 4,321 41,628
Net carrying value in balance sheet 2010422,936 1,980 11,580 4,218 40,714
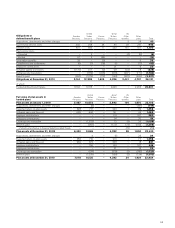
Tangible assets,
acquisition costs Buildings
Land and land
improvements
Machinery
and equipment5
Construction
in progress,
including
advance
payments
Total
investment
property,
property,
plant and
equipment
Assets under
operating
leases
Total
tangible
assets
Value in balance sheet 2009 31,859 12,641 68,851 4,578 117,929 31,993 149,922
Capital expenditures3617 119 3,806 2,446 6,988 4,893 11,881
Sales/scrapping (472) (105) (1,730) (7) (2,314) (5,459) (7,773)
Acquired and divested operations 0 0 0 0 0223 223
Translation differences (912) 50 (1,308) (148) (2,318) (2,843) (5,161)
Reclassifications and other 466 (138) 895 (1,160) 63 288 351
Value in balance sheet 2010 31,558 12,567 70,514 5,709 120,348 29,095 149,443
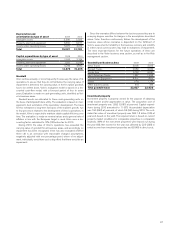
Accumulated depreciation
and amortization Buildings
Land and land
improvements
Machinery
and equipment5
Construction
in progress,
including
advance
payments
Total
investment
property,
property,
plant and
equipment
Assets under
operating
leases
Total
tangible
assets
Value in balance sheet 2009 14,780 1,042 46,827 – 62,649 11,605 74,254
Depreciation and amortization61,207 98 4,772 – 6,077 4,410 10,487
Sales/scrapping (224) (22) (1,549) – (1,795) (3,082) (4,877)
Acquired and divested operations 0 0 0 – 0(55) (55)
Translation differences (192) (20) (691) – (903) (1,142) (2,045)
Reclassifications and other (4) (32) 114 – 78 (2,288) (2,210)
Value in balance sheet 2010 15,567 1,066 49,473 – 66,106 9,448 75,554
Net carrying value in balance
sheet 2009417,079 11,599 22,024 4,578 55,280 20,388 75,668
Net carrying value in balance
sheet 20104, 7 15,991 11,501 21,041 5,709 54,242 19,647 73,889
1 Includes on the date of IFRS adoption, acquisition costs of 14,184 and
accumulated amortization of 3,863.
2 Other intangible assets mainly consist of trademarks and distribution
networks.
3 Includes capitalized borrowing costs of 92 (73).
4 Acquisition costs less accumulated depreciation, amortization and
write-downs.
5 Machinery and equipment pertains mainly to production equipment.
6 Of which write-down 33 (221).
7 Of which, investment property 948 and property, plant and equipment
53,294.
Reclassifications and other mainly consist of assets under operating
leases related to legal sales transactions, where revenue is deferred
and accounted for as operating lease revenue. Assets classified as
inventory will, when the operating lease model is applied for revenue
recognition, be reclassified from inventory to assets under operating
leases, when the legal sales transaction occurs. If the product is
returned after the lease period, there will again be a reclassification
from assets under operating leases to inventory. When a buy-back
agreement has expired, but the related product is not returned, the
acquisition cost and the accumulated depreciation are reversed in
reclassification and other, within the line item assets under operating
leases. Some of the reclassifications within tangible assets relate to
construction in progress, which are reclassified to the respective cat-
egory within property, plant and equipment.
FINANCIAL INFORMATION 2010
86