Volvo 2010 Annual Report Download - page 41
Download and view the complete annual report
Please find page 41 of the 2010 Volvo annual report below. You can navigate through the pages in the report by either clicking on the pages listed below, or by using the keyword search tool below to find specific information within the annual report.-
 1
1 -
2
-
3
-
4
-
5
-
6
-
7
-
8
-
9
-
10
-
11
-
12
-
13
-
14
-
15
-
16
-
17
-
18
-
19
-
20
-
21
-
22
-
23
-
24
-
25
-
26
-
27
-
28
-
29
-
30
-
 31
31 -
 32
32 -
 33
33 -
 34
34 -
 35
35 -
 36
36 -
 37
37 -
 38
38 -
 39
39 -
 40
40 -
 41
41 -
 42
42 -
 43
43 -
 44
44 -
 45
45 -
 46
46 -
 47
47 -
 48
48 -
 49
49 -
 50
50 -
 51
51 -
52
-
53
-
54
-
55
-
56
-
57
-
58
-
59
-
60
-
61
-
62
-
63
-
64
-
65
-
66
-
67
-
68
-
69
-
70
-
71
-
72
-
73
-
74
-
75
-
76
-
77
-
78
-
79
-
80
-
81
-
82
-
83
-
84
-
85
-
86
-
87
-
88
-
89
-
90
-
91
-
92
-
93
-
94
-
95
-
96
-
97
-
98
-
99
-
100
-
101
-
102
-
103
-
104
-
105
-
106
-
107
-
108
-
109
-
110
-
111
-
112
-
113
-
114
-
115
-
116
-
117
-
118
-
119
-
120
-
121
-
122
-
123
-
124
-
125
-
126
-
127
-
128
-
129
-
130
-
131
-
132
-
133
-
134
-
135
-
136
-
137
-
138
-
139
-
140
-
141
-
142
-
143
-
144
-
145
-
146
-
147
-
148
-
149
-
150
-
151
-
152
-
153
-
154
 |
 |
Outcome 2010
• Customer credit losses and deliveries from subsuppliers under control.
• Continued favorable growth in the industrial engine segment.
Ambitions 2011
• Increased growth rate and improved profitability in both Marine
and Industrial.
• Secure complete customer offers for fully-integrated drive systems
and instruments.
• Secure product and geographic balance in terms of sales and
profitability.
Net sales as per-
centage of Volvo
Group sales
Operating income (loss)
and oprating margin
Net sales
SEK bn
3% (4)
SEK M
%
10
578
6.6
09
(230)
(2.8)
08
928
8.1
07
1,173
10.0
06
1,106
10.3
10
8.7
09
8.2
08
11.5
07
11.7
06
10.8
Net sales by market
Volvo Penta, SEK M 2009 2010
Europe 4,390 4,507
North America 1,100 1,500
South America 284 335
Asia 2,054 2,008
Other markets 331 366
Total 8,159 8,716
Engine volumes
Volvo Penta,
No. of units 2009 2010
Marine engines 25,755 28,965
Industrial engines 19,228 22,623
Total 44,983 51,588
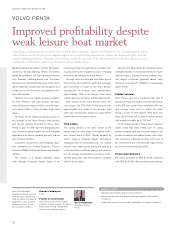
ing income amounted to SEK 578 M, compared
with an operating loss of SEK 230 M in the pre-
ceding year. The operating margin was 6.6%
(neg: 2.8). Income was positively impacted by pri-
marily the effects of cost-reduction measures,
but also to a certain extent by increased sales
and higher capacity utilization.
Production and investments
In recent years, Volvo Penta made significant
investments in a new global logistics system. The
new system, which was launched in 2010, will
facilitate streamlining the entire chain from order
to delivery.
Production in the plants in Vara, Sweden and
Lexington, USA had low capacity utilization
resulting from continued weak demand for
marine engines globally.
As a result of the increasingly strong demand
for industrial engines, Volvo Penta was able to
contribute to higher capacity utilization in the
Volvo Group’s joint diesel engine plants in
Skövde, Sweden and Lyon, France.
8.7 578
37