Volvo 2010 Annual Report Download - page 5
Download and view the complete annual report
Please find page 5 of the 2010 Volvo annual report below. You can navigate through the pages in the report by either clicking on the pages listed below, or by using the keyword search tool below to find specific information within the annual report.-
 1
1 -
 2
2 -
 3
3 -
 4
4 -
 5
5 -
 6
6 -
 7
7 -
 8
8 -
 9
9 -
 10
10 -
 11
11 -
 12
12 -
 13
13 -
 14
14 -
 15
15 -
 16
16 -
17
-
18
-
19
-
20
-
21
-
22
-
23
-
24
-
25
-
26
-
27
-
28
-
29
-
30
-
31
-
32
-
33
-
34
-
35
-
36
-
37
-
38
-
39
-
40
-
41
-
42
-
43
-
44
-
45
-
46
-
47
-
48
-
49
-
50
-
51
-
52
-
53
-
54
-
55
-
56
-
57
-
58
-
59
-
60
-
61
-
62
-
63
-
64
-
65
-
66
-
67
-
68
-
69
-
70
-
71
-
72
-
73
-
74
-
75
-
76
-
77
-
78
-
79
-
80
-
81
-
82
-
83
-
84
-
85
-
86
-
87
-
88
-
89
-
90
-
91
-
92
-
93
-
94
-
95
-
96
-
97
-
98
-
99
-
100
-
101
-
102
-
103
-
104
-
105
-
106
-
107
-
108
-
109
-
110
-
111
-
112
-
113
-
114
-
115
-
116
-
117
-
118
-
119
-
120
-
121
-
122
-
123
-
124
-
125
-
126
-
127
-
128
-
129
-
130
-
131
-
132
-
133
-
134
-
135
-
136
-
137
-
138
-
139
-
140
-
141
-
142
-
143
-
144
-
145
-
146
-
147
-
148
-
149
-
150
-
151
-
152
-
153
-
154
 |
 |
world
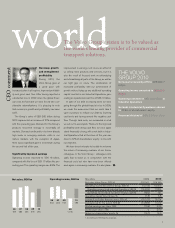
Net sales, SEK bn Operating income, SEK bn
1009080706
265218305285259
080706
09
(17.0)
15.922.220.4
10
18.0
Key ratios 2009 2010
Net sales Volvo Group, SEK M 218,361 264,749
Operating income (loss) Volvo Group, SEK M (17,013) 18,000
Operating income (loss)Industrial Operations, SEK M (16,333) 17,834
Operating income (loss)Customer Finance, SEK M (680) 167
Operating margin Volvo Group, % (7.8) 6.8
Income (Loss)after financial items, SEK M (20,573) 15,514
Income(Loss)for the period, SEK M (14,685) 11,212
Diluted earnings per share, SEK (7.26) 5.36
Dividend per share, SEK 0 2.501
Return on shareholders' equity, % (19.7) 16.0
1 According to the Board’s proposal.
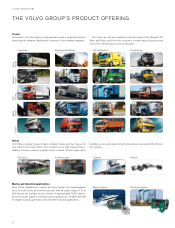
The Volvo Group’s vision is to be valued as
the world’s leading provider of commercial
transport solutions.
Recovery, growth
and strengthened
profitability
During 2010, the
Volvo Group grew at
a good pace with
increased sales in all regions, improved profitabil-
ity and good cash flow. After having reported a
substantial loss in 2009 when the global finan-
cial crisis hit hard and we were forced into con-
siderable rationalizations, it is pleasing to note
that recovery in growth and profitability has been
swift.
The Group’s sales of SEK 265 billion during
2010 represented an increase of 21% compared
with the preceding year. Demand for the Group’s
products recovered strongly in essentially all
markets. Demand continued to rise from already
high levels in emerging markets, while in our
mature markets, with the exception of Japan,
there was a significant gain in momentum during
the second half of the year.
Significantly improved earnings
Operating income improved to SEK 18 billion,
compared with the loss of SEK 17 billion the pre-
ceding year. The operating margin was 6.8%. The
improvement in earnings is of course an effect of
us selling more products and services, but it is
also the result of focused work on rationalizing
and streamlining all parts of the Group, as well as
our tight grip on costs. The combination of
increased profitability with our achievement of
growth without tying up any additional operating
capital resulted in our Industrial Operations gen-
erating an operational cash flow of SEK 19 billion.
In spite of our debt increasing when we were
going through the global financial crisis in 2009,
we made the assessment that we could take it
upon ourselves to reduce our debt by lowering
cost levels and turning around the negative cash
flow. Through hard work, we succeeded in what
we set out to accomplish. Thanks to the improved
profitability and strong cash flow, we once again
stand financially strong, with a net debt in Indus-
trial Operations that at the close of the year was
down to 37% of shareholders’ equity – in line with
our objective.
We have been fortunate to be able to welcome
the return of increasing numbers of our former
colleagues to the Volvo Group – colleagues who
sadly had to leave us in conjunction with the
financial crisis but who have now been offered
work again in increasing numbers. It is also pleas-
Net sales increased by 21% to SEK 264.7
billion
Operating income amounted to SEK 18.0
billion
Operating cash flow of SEK 19.0 billion in
Industrial Operations
Net debt in Industrial Operations reduced
to 37.4% of shareholders’ equity
Proposed dividend of SEK 2.50 per share
THE VOLVO
GROUP 2010
CEO comment
1