Volvo 2010 Annual Report Download - page 63
Download and view the complete annual report
Please find page 63 of the 2010 Volvo annual report below. You can navigate through the pages in the report by either clicking on the pages listed below, or by using the keyword search tool below to find specific information within the annual report.-
 1
1 -
2
-
3
-
4
-
5
-
6
-
7
-
8
-
9
-
10
-
11
-
12
-
13
-
14
-
15
-
16
-
17
-
18
-
19
-
20
-
21
-
22
-
23
-
24
-
25
-
26
-
27
-
28
-
29
-
30
-
31
-
32
-
33
-
34
-
35
-
36
-
37
-
38
-
39
-
40
-
41
-
42
-
43
-
44
-
45
-
46
-
47
-
48
-
49
-
50
-
51
-
52
-
 53
53 -
 54
54 -
 55
55 -
 56
56 -
 57
57 -
 58
58 -
 59
59 -
 60
60 -
 61
61 -
 62
62 -
 63
63 -
 64
64 -
 65
65 -
 66
66 -
 67
67 -
 68
68 -
 69
69 -
 70
70 -
 71
71 -
 72
72 -
 73
73 -
74
-
75
-
76
-
77
-
78
-
79
-
80
-
81
-
82
-
83
-
84
-
85
-
86
-
87
-
88
-
89
-
90
-
91
-
92
-
93
-
94
-
95
-
96
-
97
-
98
-
99
-
100
-
101
-
102
-
103
-
104
-
105
-
106
-
107
-
108
-
109
-
110
-
111
-
112
-
113
-
114
-
115
-
116
-
117
-
118
-
119
-
120
-
121
-
122
-
123
-
124
-
125
-
126
-
127
-
128
-
129
-
130
-
131
-
132
-
133
-
134
-
135
-
136
-
137
-
138
-
139
-
140
-
141
-
142
-
143
-
144
-
145
-
146
-
147
-
148
-
149
-
150
-
151
-
152
-
153
-
154
 |
 |

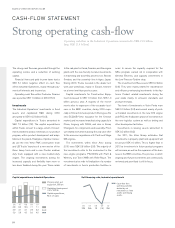
industrial system, as an effect of increased pro-
duction levels, and continued cost control.
During 2010, operating profit was negatively
impacted by higher costs for raw material and
components amounting to approximately SEK
300 M compared to the preceding year.
In 2010, research and development expenses
amounted to SEK 12,970 M (13,193). Even
though costs decreased compared with 2009,
they remained at a relatively high level primarily a
consequence of projects relating to new emis-
sion regulations in Europe, USA and Japan.
Selling expenses decreased by 5% and admin-
istration expenses by 3% compared to 2009,
depsite net sales increasing by 23%.
Since return on equity was 16%, SEK 350 M
was provisioned for profit-sharing to employees
Impact of exchange rates on operating
income
The combined effect of changed exchange rates
had a positive effect on operating income of
approximately SEK 3.2 billion in 2010, compared
with 2009. This is mainly attributable to positive
effects from forward exchange rate contracts in
2010 compared to major negative effects in
2009.
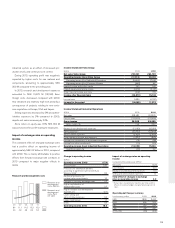
Income Statement Volvo Group
SEK M 2009 2010
Net sales Volvo Group 218,361 264,749
Operating Income (loss) Volvo Group (17,013) 18,000
Operating income (loss) Industrial Operations (16,333) 17,834
Operating income (loss) Customer Finance (680) 167
Interest income and similar credits 390 442
Interest expense and similar credits (3,559) (3,142)
Other financial income and costs (392) 213
Income after financial items (20,573) 15,514
Income taxes 5,889 (4,302)
Income for the period (14,685) 11,212
Income Statement Industrial Operations
SEK M 2009 2010
Net sales 208,487 257,375
Cost of sales (179,578) (197,480)
Gross income 28,909 59,895
Gross margin, % 13.9 23.3
Research and development expenses (13,193) (12,970)
Selling expenses (23,752) (22,649)
Administrative expenses (5,838) (5,640)
Other operating income and expenses (2,432) (659)
Income from investments in associated companies (15) (86)
Income from other investments (13) (57)
Operating income (loss) Industrial Operations (16,333) 17,834
Operating margin, % (7.8) 6.9
Impact of exchange rates on operating
income
Compared with preceding year, SEK bn
Net sales1(10.5)
Cost of sales 12.3
Research and development expenses 0.3
Selling and administrative expenses 1.1
Total effect of changes in exchange
rates on operating income 3.2
1 Group sales are reported at monthly spot rates and the
effects of currency hedges are reported among Cost of
sales.
Change in operating income
SEK bn
Operating income 2009 (17.0)
Gross income 27.2
Provisions for healthcare benefits
according to agreement with United Auto
Workers, UAW 0.9
Additional provisions for
residual value commitments 1.0
Changes in currency exchange rates 3.2
Higher capitalization of
development costs 0.7
Higher research and development
expenditures (0.7)
Lower selling and
administrative expenses 0.4
Lower credit losses 1.7
Other 0.6
Operating income 2010 18.0
Operating net flow per currency
Local currency, million 2009 2010
USD 1,803 2,410
EUR 595 373
GBP 315 405
CAD 192 241
JPY(x100) (83) (103)
Research and development costs
1009080706
13.013.214.311.18.4
5.06.34.93.93.4
Research and
development
costs, SEK bn
Research and
development
costs, % of
net sales
59