Volvo 2010 Annual Report Download - page 58
Download and view the complete annual report
Please find page 58 of the 2010 Volvo annual report below. You can navigate through the pages in the report by either clicking on the pages listed below, or by using the keyword search tool below to find specific information within the annual report.-
 1
1 -
2
-
3
-
4
-
5
-
6
-
7
-
8
-
9
-
10
-
11
-
12
-
13
-
14
-
15
-
16
-
17
-
18
-
19
-
20
-
21
-
22
-
23
-
24
-
25
-
26
-
27
-
28
-
29
-
30
-
31
-
32
-
33
-
34
-
35
-
36
-
37
-
38
-
39
-
40
-
41
-
42
-
43
-
44
-
45
-
46
-
47
-
 48
48 -
 49
49 -
 50
50 -
 51
51 -
 52
52 -
 53
53 -
 54
54 -
 55
55 -
 56
56 -
 57
57 -
 58
58 -
 59
59 -
 60
60 -
 61
61 -
 62
62 -
 63
63 -
 64
64 -
 65
65 -
 66
66 -
 67
67 -
 68
68 -
69
-
70
-
71
-
72
-
73
-
74
-
75
-
76
-
77
-
78
-
79
-
80
-
81
-
82
-
83
-
84
-
85
-
86
-
87
-
88
-
89
-
90
-
91
-
92
-
93
-
94
-
95
-
96
-
97
-
98
-
99
-
100
-
101
-
102
-
103
-
104
-
105
-
106
-
107
-
108
-
109
-
110
-
111
-
112
-
113
-
114
-
115
-
116
-
117
-
118
-
119
-
120
-
121
-
122
-
123
-
124
-
125
-
126
-
127
-
128
-
129
-
130
-
131
-
132
-
133
-
134
-
135
-
136
-
137
-
138
-
139
-
140
-
141
-
142
-
143
-
144
-
145
-
146
-
147
-
148
-
149
-
150
-
151
-
152
-
153
-
154
 |
 |

BOARD OF DIRECTORS’ REPORT 2010
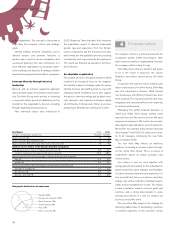
Currencies Interest rates in Sweden, Europe and the U.S.
09
7.2
10.4
04
7.3
9.1
05
7.5
9.2
06
7.4
9.3
07
6.8
9.3
08
7.8
10.9
03
8.0
9.1
02
9.7
9.1
01
10.3
9.2 7.76.5 6.7 5.8 5.8 8.66.77.37.9
Source: Reuters
10
6.7
9.0
8.3
00
9.2
8.4
8.2
SEK/USD
SEK/EUR
SEK/100 JPY
Sweden
Europe
The U.S.
07
4.3
4.3
4.0
08
2.4
2.9
2.2
09
3.4
3.4
3.8
02
5.3
4.8
4.5
03
4.6
4.1
4.0
04
4.4
4.0
4.2
05
3.4
3.4
4.3
06
3.7
3.8
4.8
01
5.1
4.8
5.0
Source: Reuters
Government bonds, 10 year benchmarks
10
3.3
3.0
3.3
%
%
%
00
5.4
5.3
6.0
Currency-related risk
More than 90% of the net sales of the Volvo
Group are generated in countries other than
Sweden. Changes in exchange rates have a
direct impact on the Volvo Group’s operating
income, balance sheet and cash flow, as well as
an indirect impact on Volvo’s competitiveness,
which over time affects the Group’s earnings.
Interest-related risk
Interest-related risk includes risks that changes
in interest rates will impact the Group’s income
and cash flow (cash-flow risks) or the fair value of
financial assets and liabilities (price risks).
Market risk from investments in shares or
similar instruments
The Volvo Group is indirectly exposed to market
risks from shares and other similar instruments,
as a result of managed capital transferred to
independent pension plans being partly invested
in instruments of these types.
Credit-related risk
An important part of the Group’s credit risk is
related to how the financial assets of the Group
have been placed. The majority are placed in
Swedish Government bonds and interest-bearing
bonds issued by Swedish real estate financing
institutions.
Liquidity risk
Volvo ensures its financial preparedness by
always maintaining a certain portion of revenues
in liquid assets.
Operational risk
The profitability depends on successful
new products
The Volvo Group’s long-term profitability depends
on the Company’s ability to successfully launch
and market its new products. Product life cycles
continue to shorten, putting increased focus on
the success of the Group’s product development.
Reliance on suppliers
Volvo purchases raw materials, parts and compo-
nents from numerous external suppliers. A sig-
nificant part of the Group’s requirements for raw
materials and supplies is filled by single-source
suppliers. The effects of delivery interruptions
vary depending on the item or component. Cer-
tain items and components are standard through-
out the industry, whereas others are internally
developed and require unique tools that are time-
consuming to replace.
The Volvo Group’s costs for raw materials and
components can vary significantly over a busi-
ness cycle. Cost variations may be caused by
changes in world market prices for raw materials
or by an inability of our suppliers to deliver.
Intangible assets
AB Volvo owns or otherwise has rights to patents
and brands that refer to the products the Com-
pany manufactures and markets. These have
been acquired over a number of years and are
valuable to the operations of the Volvo Group.
Volvo does not consider that any of the Group’s
operations are heavily dependent on any single
patent or group of patents.
Through Volvo Trademark Holding AB, AB
Volvo and Volvo Car Corporation jointly own the
Volvo brand. AB Volvo has the exclusive right to
use the Volvo name and trademark for its prod-
ucts and services. Similarly, Volvo Car Corpora-
tion has the exclusive right to use the Volvo name
and trademark for its products and services.
54