Volvo 2010 Annual Report Download - page 116
Download and view the complete annual report
Please find page 116 of the 2010 Volvo annual report below. You can navigate through the pages in the report by either clicking on the pages listed below, or by using the keyword search tool below to find specific information within the annual report.-
 1
1 -
2
-
3
-
4
-
5
-
6
-
7
-
8
-
9
-
10
-
11
-
12
-
13
-
14
-
15
-
16
-
17
-
18
-
19
-
20
-
21
-
22
-
23
-
24
-
25
-
26
-
27
-
28
-
29
-
30
-
31
-
32
-
33
-
34
-
35
-
36
-
37
-
38
-
39
-
40
-
41
-
42
-
43
-
44
-
45
-
46
-
47
-
48
-
49
-
50
-
51
-
52
-
53
-
54
-
55
-
56
-
57
-
58
-
59
-
60
-
61
-
62
-
63
-
64
-
65
-
66
-
67
-
68
-
69
-
70
-
71
-
72
-
73
-
74
-
75
-
76
-
77
-
78
-
79
-
80
-
81
-
82
-
83
-
84
-
85
-
86
-
87
-
88
-
89
-
90
-
91
-
92
-
93
-
94
-
95
-
96
-
97
-
98
-
99
-
100
-
101
-
102
-
103
-
104
-
105
-
 106
106 -
 107
107 -
 108
108 -
 109
109 -
 110
110 -
 111
111 -
 112
112 -
 113
113 -
 114
114 -
 115
115 -
 116
116 -
 117
117 -
 118
118 -
 119
119 -
 120
120 -
 121
121 -
 122
122 -
 123
123 -
 124
124 -
 125
125 -
 126
126 -
127
-
128
-
129
-
130
-
131
-
132
-
133
-
134
-
135
-
136
-
137
-
138
-
139
-
140
-
141
-
142
-
143
-
144
-
145
-
146
-
147
-
148
-
149
-
150
-
151
-
152
-
153
-
154
 |
 |

NOTES TO CONSOLIDATED FINANCIAL STATEMENTS
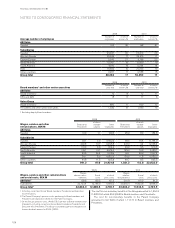
Below is a presentation of derivative instruments and options.
Outstanding derivative instruments for dealing with currency
and interest-rate risks related to financial assets and liabilities
Dec 31, 2009 Dec 31, 2010
Notional
amount
Carrying
value
Notional
amount
Carrying
value
Interest-rate swaps
– receivable
position 64,162 3,560 70,067 3,539
– payable
position 100,460 (2,948) 65,576 (3,924)
Forwards and futures
– receivable
position 0 0 900 0
– payable
position 30,274 (3) 400 0
Foreign exchange derivative contracts
– receivable
position 16,165 172 13,336 143
– payable
position 15,424 (214) 25,192 (381)
Options purchased
– receivable
position 1,985 116 1,126 181
– payable
position 353 (3) 0 0
Options written
– receivable
position 13 0 0 0
– payable
position 2,572 (117) 976 (182)
Total 563 (624)
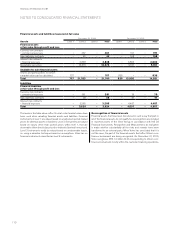
Outstanding forward contracts and options contracts for
hedging of currency risk and interest risk of commercial
receivables and liabilities
Dec 31, 2009 Dec 31, 2010
Notional
amount
Carrying
value
Notional
amount
Carrying
value
Foreign exchange derivative contracts
– receivable
position 9,307 416 6,418 188
– payable
position 5,448 (281) 3,381 (75)
Options purchased
– receivable
position 1,222 51 558 9
– payable
position – – – –
Options written
– receivable
position – – – –
– payable
position 1,193 – 558 (4)
Subtotal 186 118
Raw materials derivative contracts
– receivable
position 367 42 579 168
– payable
position 106 (58) 39 (41)
Total 170 245
FINANCIAL INFORMATION 2010
112