Volvo 2010 Annual Report Download - page 85
Download and view the complete annual report
Please find page 85 of the 2010 Volvo annual report below. You can navigate through the pages in the report by either clicking on the pages listed below, or by using the keyword search tool below to find specific information within the annual report.-
 1
1 -
2
-
3
-
4
-
5
-
6
-
7
-
8
-
9
-
10
-
11
-
12
-
13
-
14
-
15
-
16
-
17
-
18
-
19
-
20
-
21
-
22
-
23
-
24
-
25
-
26
-
27
-
28
-
29
-
30
-
31
-
32
-
33
-
34
-
35
-
36
-
37
-
38
-
39
-
40
-
41
-
42
-
43
-
44
-
45
-
46
-
47
-
48
-
49
-
50
-
51
-
52
-
53
-
54
-
55
-
56
-
57
-
58
-
59
-
60
-
61
-
62
-
63
-
64
-
65
-
66
-
67
-
68
-
69
-
70
-
71
-
72
-
73
-
74
-
 75
75 -
 76
76 -
 77
77 -
 78
78 -
 79
79 -
 80
80 -
 81
81 -
 82
82 -
 83
83 -
 84
84 -
 85
85 -
 86
86 -
 87
87 -
 88
88 -
 89
89 -
 90
90 -
 91
91 -
 92
92 -
 93
93 -
 94
94 -
 95
95 -
96
-
97
-
98
-
99
-
100
-
101
-
102
-
103
-
104
-
105
-
106
-
107
-
108
-
109
-
110
-
111
-
112
-
113
-
114
-
115
-
116
-
117
-
118
-
119
-
120
-
121
-
122
-
123
-
124
-
125
-
126
-
127
-
128
-
129
-
130
-
131
-
132
-
133
-
134
-
135
-
136
-
137
-
138
-
139
-
140
-
141
-
142
-
143
-
144
-
145
-
146
-
147
-
148
-
149
-
150
-
151
-
152
-
153
-
154
 |
 |

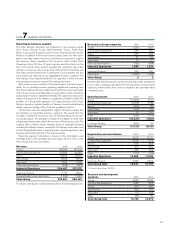
NOTE 7 SEGMENT REPORTING
Reporting by business segment
The Volvo Group’s operations are organized in nine business areas:
Volvo Trucks, Renault Trucks, North American Trucks, Trucks Asia,
Buses, Construction Equipment, Volvo Penta, Volvo Aero and Customer
Finance. In addition to the nine business areas, there are other oper-
ations consisting mainly of business units that are designed to support
the business areas’ operations. The business units include Volvo
Power train, Volvo 3P, Volvo IT, Volvo Logistics and Volvo Parts. As the
four truck brands share product development, production and other
activities in business units such as Volvo 3P and Volvo Powertrain and
also share certain infrastructure in distribution such as dealers, the four
truck brands are reported as one aggregated business segment. The
Volvo Group is thus reported divided in six segments in which net sales
and operating income are reported for each product area.
Each business area, except for Customer Finance, has total respon-
sibility for its operating income, operating capital and operating cash
flow. Volvo Financial Services within Customer Finance has responsibil-
ity for its net income and total balance sheet within certain restrictions
and principles that are established centrally. The supervision and coord-
ination of treasury and tax matters is organized centrally to obtain the
benefits of a Group-wide approach. The legal structure of the Volvo
Group is based on optimal handling of treasury, tax and administrative
matters and, accordingly, differs from the operating structure.
The business units are designated to support the business areas and
are therefore not reportable business segments. The results from the
synergies created in the business units are transferred back to the vari-
ous product areas. The allocation is based on the degree to which indi-
vidual product areas have utilized the services of the business units. The
heading Other contains mainly earnings linked to corporate functions
including the Group’s treasury operations. The Group’s real estate, held
in Volvo Group Real Estate, is reported under industrial operations, and
earnings are transferred back to the business areas.
Reported segment information is based on the information used
internally by the chief operating decision maker, which in Volvo is the
Volvo Group Executive Committee.
Net sales 2009 2010
Trucks 138,940 167,305
Construction Equipment 35,658 53,810
Buses 18,465 20,516
Volvo Penta 8,159 8,716
Volvo Aero 7,803 7,708
Other and eliminations (538) (680)
Industrial Operations 208,487 257,375
Customer Finance 11,712 9,031
Reclassifications and eliminations (1,838) (1,657)
Volvo Group 218,361 264,749
The above sales figures include internal sales in the following amounts:
Net sales to Group companies 2009 2010
Trucks 1,558 1,421
Construction Equipment 234 347
Buses 461 490
Volvo Penta 87 129
Volvo Aero 37 21
Other and eliminations (782) (984)
Industrial Operations 1,595 1,424
Customer Finance 243 231
Eliminations (1,838) (1,655)
Volvo Group 0 0
Internal sales between business areas are generally made at standard
cost of sales, including calculated interest and product improvement
expenses. Internal sales from service companies are generally made
at market prices.
Operating income 2009 2010
Trucks (10,805) 10,112
Construction Equipment (4,005) 6,180
Buses (350) 780
Volvo Penta (230) 578
Volvo Aero 50 286
Other (994) (102)
Industrial Operations (16,333) 17,834
Customer Finance (680) 167
Volvo Group (17,013) 18,000
Depreciation and amortization 2009 2010
Trucks 9,618 8,721
Construction Equipment 2,036 1,975
Buses 555 464
Volvo Penta 515 453
Volvo Aero 435 436
Other (777) (710)
Industrial Operations 12,382 11,338
Customer Finance 2,845 2,454
Volvo Group total115,227 13,792
1 Of which write-down 33 (221).
Research and development
expenses 2009 2010
Trucks 9,525 9,230
Construction Equipment 1,982 1,972
Buses 918 882
Volvo Penta 665 670
Volvo Aero 170 156
Other (67) 60
Volvo Group total 13,193 12,970
81