Volvo 2010 Annual Report Download - page 124
Download and view the complete annual report
Please find page 124 of the 2010 Volvo annual report below. You can navigate through the pages in the report by either clicking on the pages listed below, or by using the keyword search tool below to find specific information within the annual report.-
 1
1 -
2
-
3
-
4
-
5
-
6
-
7
-
8
-
9
-
10
-
11
-
12
-
13
-
14
-
15
-
16
-
17
-
18
-
19
-
20
-
21
-
22
-
23
-
24
-
25
-
26
-
27
-
28
-
29
-
30
-
31
-
32
-
33
-
34
-
35
-
36
-
37
-
38
-
39
-
40
-
41
-
42
-
43
-
44
-
45
-
46
-
47
-
48
-
49
-
50
-
51
-
52
-
53
-
54
-
55
-
56
-
57
-
58
-
59
-
60
-
61
-
62
-
63
-
64
-
65
-
66
-
67
-
68
-
69
-
70
-
71
-
72
-
73
-
74
-
75
-
76
-
77
-
78
-
79
-
80
-
81
-
82
-
83
-
84
-
85
-
86
-
87
-
88
-
89
-
90
-
91
-
92
-
93
-
94
-
95
-
96
-
97
-
98
-
99
-
100
-
101
-
102
-
103
-
104
-
105
-
106
-
107
-
108
-
109
-
110
-
111
-
112
-
113
-
 114
114 -
 115
115 -
 116
116 -
 117
117 -
 118
118 -
 119
119 -
 120
120 -
 121
121 -
 122
122 -
 123
123 -
 124
124 -
 125
125 -
 126
126 -
 127
127 -
 128
128 -
 129
129 -
 130
130 -
 131
131 -
 132
132 -
 133
133 -
 134
134 -
135
-
136
-
137
-
138
-
139
-
140
-
141
-
142
-
143
-
144
-
145
-
146
-
147
-
148
-
149
-
150
-
151
-
152
-
153
-
154
 |
 |
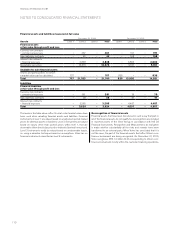
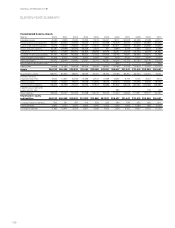
NOTES AND COMMENTS
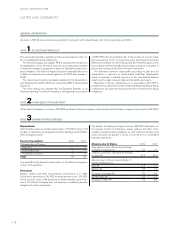
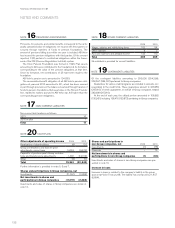
NOTE 11 INCOME TAXES
2009 2010
Current taxes 59 (176)
Deferred taxes 4,478 (1,055)
Total income taxes 4,537 (1,231)
Current taxes relate to prior periods.
Claims as a consequence of tax audit carried out previously for which
provisions are not deemed necessary amount to – (249). The amount
is included in contingent liabilities.
Deferred taxes relate to estimated tax on the change in tax-loss
carryforwards and temporary differences. Deferred tax assets are
reported to the extent that it is probable that the amount can be uti-
lized against future taxable income.
Deferred taxes related to change in tax-loss carryforwards amount
to an expense of 1,063 (4,472) and to changes in other temporary
differences to 8 (6).
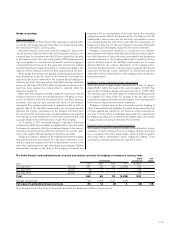
The table below shows the principal reasons for the difference
between the corporate income tax of 26.3% and the tax for the period.
2009 2010
Income before taxes (6,776) 11,559
Income tax according to applicable tax rate 1,782 (3,040)
Capital gains/losses 0 0
Non-taxable dividends 2,703 2,146
Non-taxable revaluations of shareholdings (1) (8)
Other non-deductible expenses (23) (156)
Other non-taxable income 17 3
Adjustment of current taxes for prior periods 59 (176)
Income taxes for the period 4,537 (1,231)
Specification of deferred tax assets 2009 2010
Tax-loss carryforwards 4,550 3,487
Valuation allowancefor doubtful receivables 1 1
Provision for post-employment benefits 161 169
Deferred tax assets 4,712 3,657
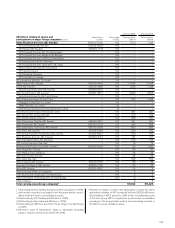
NOTE 12 INTANGIBLE AND TANGIBLE ASSETS
Acquisition cost Value in balance sheet 2009 Investments Value in balance sheet 2010
Rights 52 52
Other intangible assets 116 22 138
Total intangible assets 168 22 190
Buildings 6 – 6
Land and land improvements 3 – 3
Machinery and equipment 45 1 46
Total tangible assets 54 1 55
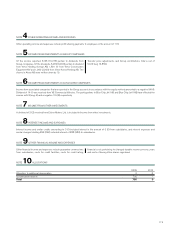
Accumulated depreciation Value in balance
sheet 20091Depreciation2
Value in balance
sheet 2010
Net carrying
value in balance
sheet 20103
Rights 52 – 52 0
Other intangible assets 20 15 35 103
Total intangible assets 72 15 87 103
Buildings 2 0 2 4
Land and land improvements 0 0 0 3
Machinery and equipment 36 1 37 9
Total tangible assets 38 1 39 16
The assessed value of buildings was 3 (3) and of land 3 (3). Capital
expenditures in intangible and tangible assets amounted to 22 (–) and
1 (0) respectively. Capital expenditures approved but not yet imple-
mented at year-end 2010 amounted to 0 (–).
1 Including accumulated write-downs.
2 Including write-downs.
3 Acquisition value, less accumulated depreciation, amortization and write-
downs.
FINANCIAL INFORMATION 2010
120