Volvo 2010 Annual Report Download - page 108
Download and view the complete annual report
Please find page 108 of the 2010 Volvo annual report below. You can navigate through the pages in the report by either clicking on the pages listed below, or by using the keyword search tool below to find specific information within the annual report.-
 1
1 -
2
-
3
-
4
-
5
-
6
-
7
-
8
-
9
-
10
-
11
-
12
-
13
-
14
-
15
-
16
-
17
-
18
-
19
-
20
-
21
-
22
-
23
-
24
-
25
-
26
-
27
-
28
-
29
-
30
-
31
-
32
-
33
-
34
-
35
-
36
-
37
-
38
-
39
-
40
-
41
-
42
-
43
-
44
-
45
-
46
-
47
-
48
-
49
-
50
-
51
-
52
-
53
-
54
-
55
-
56
-
57
-
58
-
59
-
60
-
61
-
62
-
63
-
64
-
65
-
66
-
67
-
68
-
69
-
70
-
71
-
72
-
73
-
74
-
75
-
76
-
77
-
78
-
79
-
80
-
81
-
82
-
83
-
84
-
85
-
86
-
87
-
88
-
89
-
90
-
91
-
92
-
93
-
94
-
95
-
96
-
97
-
 98
98 -
 99
99 -
 100
100 -
 101
101 -
 102
102 -
 103
103 -
 104
104 -
 105
105 -
 106
106 -
 107
107 -
 108
108 -
 109
109 -
 110
110 -
 111
111 -
 112
112 -
 113
113 -
 114
114 -
 115
115 -
 116
116 -
 117
117 -
 118
118 -
119
-
120
-
121
-
122
-
123
-
124
-
125
-
126
-
127
-
128
-
129
-
130
-
131
-
132
-
133
-
134
-
135
-
136
-
137
-
138
-
139
-
140
-
141
-
142
-
143
-
144
-
145
-
146
-
147
-
148
-
149
-
150
-
151
-
152
-
153
-
154
 |
 |

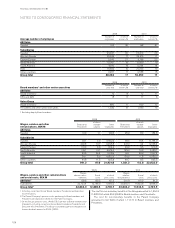
NOTES TO CONSOLIDATED FINANCIAL STATEMENTS
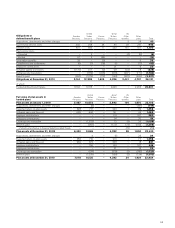
2009 2010
Average number of employees Number of
employees
of which
women, %
Number of
employees
of which
women, %
AB Volvo
Sweden 190 46 198 51
Subsidiaries
Sweden 23,637 20 23,313 20
Western Europe 25,533 17 23,515 17
Eastern Europe 5,542 21 5,768 22
North America 10,091 18 12,429 19
South America 4,180 14 5,264 14
Asia 16,650 10 21,205 10
Other countries 2,261 17 2,558 15
Group total 88,084 17 94,250 17
2009 2010
Board members1 and other senior executives Number at
year-end
of which
women, %
Number at
year-end
of which
women, %
AB Volvo
Board members112 8 12 17
CEO and GEC 18 6 17 6
Volvo Group
Board members1880 11 929 12
Presidentsand other senior executives 1,330 19 1,053 15
1 Excluding deputy Board members.
2009 2010
Wages, salaries and other
remunerations, SEK M Board and
Presidents1
of which
variable
salaries
Other
employees
Board and
Presidents1
of which
variable
salaries
Other
employees
AB Volvo
Sweden 19.0 1.1 140.6 26.2 8.0 184.6
Subsidiaries
Sweden 56.1 5.0 9,662.6 69.5 16.4 10,144.9
Western Europe 432.8 10.7 9,995.8 447.0 4.4 9,338.4
Eastern Europe 110.0 9.6 904.2 43.9 3.5 913.8
North America 142.1 14.7 4,974.0 182.2 19.9 5,188.1
South America 43.5 29.4 1,015.9 60.1 40.3 1,297.4
Asia 93.1 5.6 4,602.9 155.6 11.8 5,099.3
Other countries 44.6 11.5 625.8 46.7 8.5 665.5
Group total 941.2 87.6 31,921.8 1,031.2 112.8 32,832.0
2009 2010
Wages, salaries and other remunerations
and social costs, SEK M
Wages,
salaries, remu-
nerations
Social
costs
of which
pens. costs
Wages,
salaries,
remunerations
Social
costs
of which
pens. costs
AB Volvo2159.6 139.5 107.5 210.8 119.9 81.9
Subsidiaries 32,703.4 12,746.0 4,593.2 33,652.4 11,823.6 4,658.0
Group total332,863.0 12,885.5 4,700.7 33,863.2 11,943.5 4,739.9
1 Including current and former Board members, Presidents and Executive
Vice Presidents.
2 The Parent Company’s pension costs, pertaining to Board members and
Presidents are disclosed in Note 3 in the Parent Company.
3 Of the Group’s pension costs, 146.6 (135.1) pertain to Board members and
Presidents, including current and former Board members, Presidents and
Executive Vice Presidents. The Group’s outstanding pension obligations to
these individuals amount to 334.4 (267.2).
The cost for non-monetary benefits in the Group amounted to 1,554.3
(1,300.0) of which 59.3 (49.3) to Board members and Presidents.
The cost for non-monetary benefits in the Parent Company
amounted to 9.0 (9.8) of which 1.7 (1.7) to Board members and
Presidents.
FINANCIAL INFORMATION 2010
104