Volvo 2010 Annual Report Download - page 37
Download and view the complete annual report
Please find page 37 of the 2010 Volvo annual report below. You can navigate through the pages in the report by either clicking on the pages listed below, or by using the keyword search tool below to find specific information within the annual report.-
 1
1 -
2
-
3
-
4
-
5
-
6
-
7
-
8
-
9
-
10
-
11
-
12
-
13
-
14
-
15
-
16
-
17
-
18
-
19
-
20
-
21
-
22
-
23
-
24
-
25
-
26
-
 27
27 -
 28
28 -
 29
29 -
 30
30 -
 31
31 -
 32
32 -
 33
33 -
 34
34 -
 35
35 -
 36
36 -
 37
37 -
 38
38 -
 39
39 -
 40
40 -
 41
41 -
 42
42 -
 43
43 -
 44
44 -
 45
45 -
 46
46 -
 47
47 -
48
-
49
-
50
-
51
-
52
-
53
-
54
-
55
-
56
-
57
-
58
-
59
-
60
-
61
-
62
-
63
-
64
-
65
-
66
-
67
-
68
-
69
-
70
-
71
-
72
-
73
-
74
-
75
-
76
-
77
-
78
-
79
-
80
-
81
-
82
-
83
-
84
-
85
-
86
-
87
-
88
-
89
-
90
-
91
-
92
-
93
-
94
-
95
-
96
-
97
-
98
-
99
-
100
-
101
-
102
-
103
-
104
-
105
-
106
-
107
-
108
-
109
-
110
-
111
-
112
-
113
-
114
-
115
-
116
-
117
-
118
-
119
-
120
-
121
-
122
-
123
-
124
-
125
-
126
-
127
-
128
-
129
-
130
-
131
-
132
-
133
-
134
-
135
-
136
-
137
-
138
-
139
-
140
-
141
-
142
-
143
-
144
-
145
-
146
-
147
-
148
-
149
-
150
-
151
-
152
-
153
-
154
 |
 |
Outcome 2010
• Increased sales in all regions and the company reported positive results.
• Costs decreased and inventories levels were lower.
• Higher sales and income in the aftermarket operations.
• The new products were introduced and were received very well by customers.
Ambitions 2011
• Profitable growth in all regions.
• Increased aftermarket operations.
• Increased utilization of global production presence.
• Focus on cost and capital efficiency.
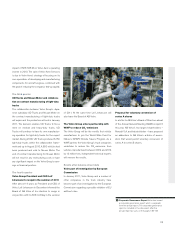
M to a positive SEK 780 and the operating mar-
gin was 3.8% (neg: 1.9). An important explana-
tion for the strong income improvement is higher
sales. Another explanation is the effort from the
company to reduce costs and streamline the
product offering and production.
New bus generates rational production
During the year, Volvo Buses launched a new
intercity bus in Europe, the Volvo 8900. It is
lighter and more fuel-efficient and will replace
two similar bus models. The new bus is built in
a module system and can be manufactured in
Volvo’s plants in Sweden and Poland. This will
generate a more rational and flexible production.
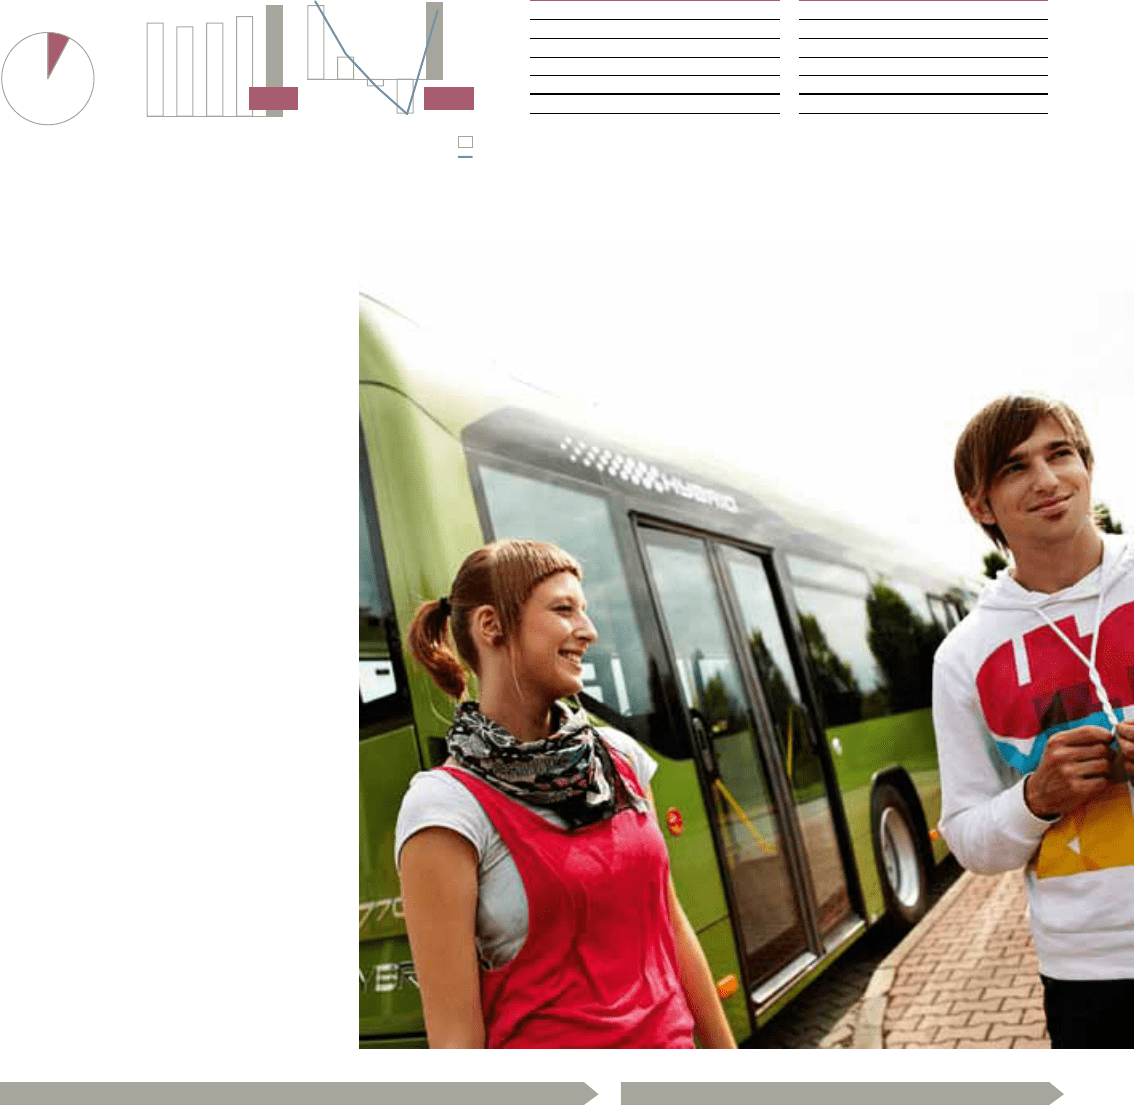
Net sales as per-
centage of Volvo
Group sales
Operating income (loss) and
operating margin
Net sales
SEK bn
8% (8)
10
20.5
09
18.5
08
17.3
07
16.6
06
17.3 SEK M
%
10
780
3.8
09
(350)
(1.9)
08
(76)
(0.4)
07
231
1.4
06
745
4.3
Net sales by market
Buses, SEK M 2009 2010
Europe 7,707 6,242
North America 5,673 7,200
South America 1,235 1,737
Asia 2,749 3,299
Other markets 1,101 2,038
Total 18,465 20,516
Deliveries by market
Buses 2009 2010
Europe 3,164 2,395
North America 1,539 2,092
South America 690 1,174
Asia 3,839 3,477
Other markets 625 1,091
Total 9,857 10,229
20.5 780
33