Volvo 2010 Annual Report Download - page 69
Download and view the complete annual report
Please find page 69 of the 2010 Volvo annual report below. You can navigate through the pages in the report by either clicking on the pages listed below, or by using the keyword search tool below to find specific information within the annual report.-
 1
1 -
2
-
3
-
4
-
5
-
6
-
7
-
8
-
9
-
10
-
11
-
12
-
13
-
14
-
15
-
16
-
17
-
18
-
19
-
20
-
21
-
22
-
23
-
24
-
25
-
26
-
27
-
28
-
29
-
30
-
31
-
32
-
33
-
34
-
35
-
36
-
37
-
38
-
39
-
40
-
41
-
42
-
43
-
44
-
45
-
46
-
47
-
48
-
49
-
50
-
51
-
52
-
53
-
54
-
55
-
56
-
57
-
58
-
 59
59 -
 60
60 -
 61
61 -
 62
62 -
 63
63 -
 64
64 -
 65
65 -
 66
66 -
 67
67 -
 68
68 -
 69
69 -
 70
70 -
 71
71 -
 72
72 -
 73
73 -
 74
74 -
 75
75 -
 76
76 -
 77
77 -
 78
78 -
 79
79 -
80
-
81
-
82
-
83
-
84
-
85
-
86
-
87
-
88
-
89
-
90
-
91
-
92
-
93
-
94
-
95
-
96
-
97
-
98
-
99
-
100
-
101
-
102
-
103
-
104
-
105
-
106
-
107
-
108
-
109
-
110
-
111
-
112
-
113
-
114
-
115
-
116
-
117
-
118
-
119
-
120
-
121
-
122
-
123
-
124
-
125
-
126
-
127
-
128
-
129
-
130
-
131
-
132
-
133
-
134
-
135
-
136
-
137
-
138
-
139
-
140
-
141
-
142
-
143
-
144
-
145
-
146
-
147
-
148
-
149
-
150
-
151
-
152
-
153
-
154
 |
 |

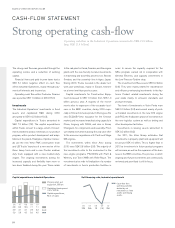
Consolidated cash-flow statements
Industrial Operations Customer Finance Eliminations Volvo Group
SEK bn 2009 2010 2009 2010 2009 2010 2009 2010
Operating activities
Operating income (16.3) 17.8 (0.7) 0.2 0.0 0.0 (17.0) 18.0
Depreciation tangible assets 6.5 6.1 0.0 0.0 0.0 0.0 6.5 6.1
Amortization intangible assets 3.6 3.3 0.0 0.0 0.0 0.0 3.6 3.3
Depreciation leasing vehicles 2.3 2.0 2.8 2.4 0.0 0.0 5.1 4.4
Other non-cash items 2.3 0.1 2.0 1.3 0.1 0.2 4.4 1.6
Total change in working capital, of which 4.7 4.6 11.8 0.1 0.4 0.1 16.9 4.8
Change in accounts receivables 8.2 (4.0) 0.0 0.3 0.0 0.0 8.2 (3.7)
Change in inventories 16.3 (4.8) (1.1) 0.8 0.0 0.1 15.2 (3.9)
Change in trade payables (14.4) 13.1 (0.1) 0.0 0.1 (0.1) (14.4) 13.0
Other changes in working capital (5.4) 0.3 13.0 (1.0) 0.3 0.1 7.9 (0.6)
Net of interest and other financial items (3.0) (2.8) 0.0 0.0 0.0 (0.1) (3.0) (2.9)
Income taxes paid (1.7) (2.3) 0.1 (0.3) 0.0 0.0 (1.6) (2.6)
Cash flow from operating activities (1.6) 28.8 16.0 3.7 0.5 0.2 14.9 32.7
Investing activities
Investments intangible assets (7.5) (6.7) 0.0 (0.1) (0.2) 0.0 (7.7) (6.8)
Investments in intangible assets (2.8) (3.6) 0.0 0.0 0.0 0.0 (2.8) (3.6)
Investment in leasing vehicles (0.2) (0.3) (4.0) (4.5) 0.0 0.0 (4.2) (4.8)
Disposals of fixed assets and leasing vehicles 0.7 0.8 3.1 2.3 0.0 0.0 3.8 3.1
Operating cash flow (11.4) 19.0 15.1 1.4 0.3 0.2 4.0 20.6
Investments and divestments of shares, net 0.0 (0.1)
Acquired and divested operations, net 0.2 0.6
Interest-bearing receivables including marketable securites (8.9) 6.8
Cash-flow after net investments (4.7) 27.9
Financing activities
Change in loans, net 12.6 (25.7)
Paymentto AB Volvo shareholders (4.1) 0.0
Payment to minority shareholders 0.0 (0.1)
Other (0.1) 0.0
Change in cash and cash equivalents excluding translation differences 3.7 2.1
Translation difference on cash and cash equivalents (0.2) (0.4)
Change in cash and cash equivalents 3.5 1.7
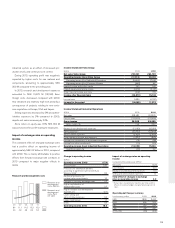
Acquisitions and divestments
Investments and divestments in shares and par-
ticipation had a negative impact on cash flow of
SEK 0.1 billion (0.0).
Acquired and divested companies 2010 had a
positive impact on cash flow of SEK 0.6 billion
(positive 0.2).
Financing and dividend
Net borrowings decreased cash and cash equiv-
alents by SEK 25.7 billion during 2010.
No dividend was paid during the year to the
shareholders of AB Volvo.
Change in cash and cash equivalents
The Group’s cash and cash equivalents increased
by SEK 1.7 billion during the year and amounted to
SEK 23.0 billion at December 31, 2010.
65