Volvo 2010 Annual Report Download - page 89
Download and view the complete annual report
Please find page 89 of the 2010 Volvo annual report below. You can navigate through the pages in the report by either clicking on the pages listed below, or by using the keyword search tool below to find specific information within the annual report.-
 1
1 -
2
-
3
-
4
-
5
-
6
-
7
-
8
-
9
-
10
-
11
-
12
-
13
-
14
-
15
-
16
-
17
-
18
-
19
-
20
-
21
-
22
-
23
-
24
-
25
-
26
-
27
-
28
-
29
-
30
-
31
-
32
-
33
-
34
-
35
-
36
-
37
-
38
-
39
-
40
-
41
-
42
-
43
-
44
-
45
-
46
-
47
-
48
-
49
-
50
-
51
-
52
-
53
-
54
-
55
-
56
-
57
-
58
-
59
-
60
-
61
-
62
-
63
-
64
-
65
-
66
-
67
-
68
-
69
-
70
-
71
-
72
-
73
-
74
-
75
-
76
-
77
-
78
-
 79
79 -
 80
80 -
 81
81 -
 82
82 -
 83
83 -
 84
84 -
 85
85 -
 86
86 -
 87
87 -
 88
88 -
 89
89 -
 90
90 -
 91
91 -
 92
92 -
 93
93 -
 94
94 -
 95
95 -
 96
96 -
 97
97 -
 98
98 -
 99
99 -
100
-
101
-
102
-
103
-
104
-
105
-
106
-
107
-
108
-
109
-
110
-
111
-
112
-
113
-
114
-
115
-
116
-
117
-
118
-
119
-
120
-
121
-
122
-
123
-
124
-
125
-
126
-
127
-
128
-
129
-
130
-
131
-
132
-
133
-
134
-
135
-
136
-
137
-
138
-
139
-
140
-
141
-
142
-
143
-
144
-
145
-
146
-
147
-
148
-
149
-
150
-
151
-
152
-
153
-
154
 |
 |

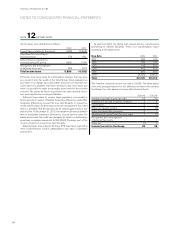
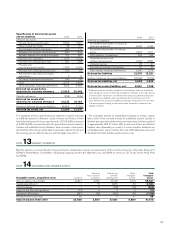
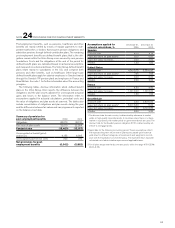
Specification of deferred tax assets
and tax liabilities 2009 2010
Deferred tax assets:
Unused tax-loss carryforwards 8,939 7,327
Other unused tax credits 85 121
Intercompany profitin inventories 459 711
Allowance for inventory obsolescence 860 439
Valuation allowance for doubtful receivables 702 587
Provisions for warranties 1,071 1,722
Provisions for residual value risks 387 306
Provisions for
post-employment benefits 2,066 2,068
Provisions for restructuring measures 169 61
Adjustment to fair valueat company
acquisitions 0 12
Fair value of derivative instruments 240 45
Land 2,377 2,455
Other deductible temporary differences 4,474 4,594
Deferred tax assets before
deduction for valuation allowance 21,829 20,448
Valuation allowance (296) (339)
Deferred tax assets after
deduction for valuation allowance 21,533 20,109
Netting of deferred tax assets/liabilities (8,938) (7,799)
Deferred tax assets, net 12,595 12,310
2009 2010
Deferred tax liabilities:
Accelerated depreciation on property,
plant and equipment 4,046 4,094
Accelerated depreciation on leasing
assets 2,073 2,111
LIFO valuation of inventories 228 224
Capitalized product and
software development 3,724 3,597
Untaxed reserves 98 97
Fair value of derivative instruments 67 20
Other taxable temporary differences 2,340 2,178
Deferred tax liabilities 12,576 12,321
Netting of deferred tax assets/liabilities (8,938) (7,799)
Deferred tax liabilities, net 3,638 4,522
Deferred tax assets/liabilities, net18,957 7,788
1 Deferred taxes are partially recognized in the balance sheet on a net basis
after taking into account offsetting possibilities. Changes in tax rates during
2010 and 2011 have been considered when measuring deferred tax assets
and deferred tax liabilities and have affected the income tax cost of the
year. Deferred tax assets and liabilities have been measured to the tax rates
that are expected to apply to the period when the asset is realized or the
liability is settled.
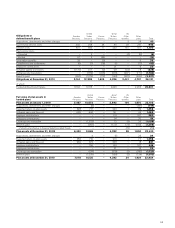
NOTE 14 INTANGIBLE AND TANGIBLE ASSETS
NOTE 13 MINORITY INTERESTS
Intangible assets, acquisition costs Goodwill1
Entrance
fees, industrial
programs
Product and
software
development
Other
intangible
assets2
Total
intangible
assets
Value in balance sheet 2009 23,827 3,833 25,148 6,719 59,527
Capital expenditures3– 15 3,255 54 3,324
Sales/scrapping – 0 (156) (79) (235)
Acquired and divested operations (70) 0 0 0 (70)
Translation differences (847) (49) (400) 138 (1,158)
Reclassifications and other 26 1 4 57 88
Value in balance sheet 2010 22,936 3,800 27,851 6,889 61,476
Minority interests in income (loss) for the period and in shareholders' equity consisted mainly of the minority interests in Volvo Aero Norge A/S
(22%), in Berliet Maroc S.A (30%), in Shandong Lingong Construction Machinery Co, Ltd (30%) as well as in UD Trucks South Africa (Pty)
Ltd (20%).
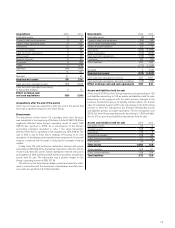
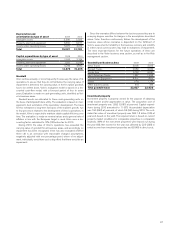
The significant tax-loss carryforwards are related to countries with long
or indefinite periods of utilization, mainly Sweden and France. Of the
total deferred tax asset for loss carryforwards 7,327 (8,939), an amount
of 3,665 (4,653) in income (loss) for the period and in equity relates to
Sweden with indefinite time of utilization. Volvo considers it most prob-
able that the Volvo Group will be able to generate sufficient income in
the coming years to utilize the tax loss carryforwards. See note 2.
The cumulative amount of undistributed earnings in foreign subsid-
iaries, which Volvo currently intends to indefinitely reinvest outside of
Sweden and upon which deferred income taxes have not been provided
is approximately SEK 47 billion (40) at year end. There are different
taxation rules depending on country. In some countries dividends are
not taxable and in some countries there are withholding taxes. See note
36 about how Volvo handles equity currency risk.
85