Volvo 2010 Annual Report Download - page 33
Download and view the complete annual report
Please find page 33 of the 2010 Volvo annual report below. You can navigate through the pages in the report by either clicking on the pages listed below, or by using the keyword search tool below to find specific information within the annual report.-
 1
1 -
2
-
3
-
4
-
5
-
6
-
7
-
8
-
9
-
10
-
11
-
12
-
13
-
14
-
15
-
16
-
17
-
18
-
19
-
20
-
21
-
22
-
 23
23 -
 24
24 -
 25
25 -
 26
26 -
 27
27 -
 28
28 -
 29
29 -
 30
30 -
 31
31 -
 32
32 -
 33
33 -
 34
34 -
 35
35 -
 36
36 -
 37
37 -
 38
38 -
 39
39 -
 40
40 -
 41
41 -
 42
42 -
 43
43 -
44
-
45
-
46
-
47
-
48
-
49
-
50
-
51
-
52
-
53
-
54
-
55
-
56
-
57
-
58
-
59
-
60
-
61
-
62
-
63
-
64
-
65
-
66
-
67
-
68
-
69
-
70
-
71
-
72
-
73
-
74
-
75
-
76
-
77
-
78
-
79
-
80
-
81
-
82
-
83
-
84
-
85
-
86
-
87
-
88
-
89
-
90
-
91
-
92
-
93
-
94
-
95
-
96
-
97
-
98
-
99
-
100
-
101
-
102
-
103
-
104
-
105
-
106
-
107
-
108
-
109
-
110
-
111
-
112
-
113
-
114
-
115
-
116
-
117
-
118
-
119
-
120
-
121
-
122
-
123
-
124
-
125
-
126
-
127
-
128
-
129
-
130
-
131
-
132
-
133
-
134
-
135
-
136
-
137
-
138
-
139
-
140
-
141
-
142
-
143
-
144
-
145
-
146
-
147
-
148
-
149
-
150
-
151
-
152
-
153
-
154
 |
 |

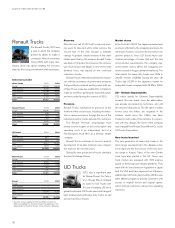
Outcome 2010
• Strong increase in deliveries in Asia (+55%) and South America (+71%).
• Turned loss into profit of SEK 10 billion.
• The trucks with new engines captured market shares in the U.S.
• The new Quon truck with Group engine well-received by customers in Japan.
Ambitions 2011
• Manage to ramp up production in line with demand.
• Increase productivity in all parts of the business.
• Continued cost control.
• Secure delivery of product development projects according to plan.
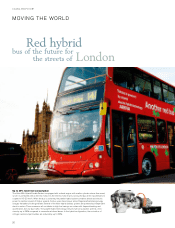
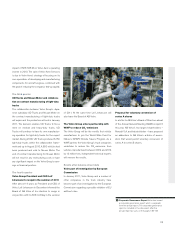
Consistent product development
Throughout the crisis, Volvo Trucks maintained its
investments in the dealer network, production
system and product development. Two new
trucks were launched in 2010 in line with long-
term plans. The company consolidated its pos-
ition in the building and construction segment
through the launch of a new truck specialized for
the segment, the Volvo FMX. Additionally, a new
version of the Volvo FM distribution truck was
launched. Both trucks were well-received by cus-
tomers throughout the world.
In North America, customers responded very
positively to Volvo’s new trucks equipped with
engines that meet the EPA 2010 emission require-
ment, which entered force on January 1, 2010,
thus strengthening the market position.
The year has seen the company make signifi-
cant progress in the environmental area through
presentation of new solutions and field testing
with key customers of alternative fuels, including
bio-DME, methane-diesel and hybrid technology.
63% (63)
Net sales as per-
centage of Volvo
Group’s sales
Operating income (loss)
and operating margin
Net sales
SEK bn
Net sales by market
Trucks, SEK M 2009 2010
Europe 65,874 69,606
North America 21,563 26,901
South America 12,490 21,680
Asia 26,943 35,231
Other markets 12,069 13,888
Total 138,940 167,305
Deliveries by market
Trucks 2009 2010
Europe 49,145 65,503
North America 17,574 24,282
South America 12,587 21,483
Asia 34,800 53,833
Other markets 13,575 14,888
Total 127,681 179,989
SEK M
%
10
6.6
09
(7.8)
08
6.0
07
8.1
06
10,112(10,805)12,16715,19313,116
7.7
1009080706
167.3138.9203.6187.9171.3
10091009
10.2%10.6%14.2%13.2%
Volvo Renault
Market shares in Europe,
heavy-duty trucks
10091009
7.4%
7.4%8.8%7.4%
Mack Volvo
Market shares in North America,
heavy-duty trucks
22.2%23.3%
UD
1009
Market shares in Japan,
heavy-duty trucks
10091009
10.9%11.6%5.2%5.4%
Volvo Renault
Market shares in Europe,
medium-duty trucks
167.3 10,112
29