Volvo 2010 Annual Report Download - page 93
Download and view the complete annual report
Please find page 93 of the 2010 Volvo annual report below. You can navigate through the pages in the report by either clicking on the pages listed below, or by using the keyword search tool below to find specific information within the annual report.-
 1
1 -
2
-
3
-
4
-
5
-
6
-
7
-
8
-
9
-
10
-
11
-
12
-
13
-
14
-
15
-
16
-
17
-
18
-
19
-
20
-
21
-
22
-
23
-
24
-
25
-
26
-
27
-
28
-
29
-
30
-
31
-
32
-
33
-
34
-
35
-
36
-
37
-
38
-
39
-
40
-
41
-
42
-
43
-
44
-
45
-
46
-
47
-
48
-
49
-
50
-
51
-
52
-
53
-
54
-
55
-
56
-
57
-
58
-
59
-
60
-
61
-
62
-
63
-
64
-
65
-
66
-
67
-
68
-
69
-
70
-
71
-
72
-
73
-
74
-
75
-
76
-
77
-
78
-
79
-
80
-
81
-
82
-
 83
83 -
 84
84 -
 85
85 -
 86
86 -
 87
87 -
 88
88 -
 89
89 -
 90
90 -
 91
91 -
 92
92 -
 93
93 -
 94
94 -
 95
95 -
 96
96 -
 97
97 -
 98
98 -
 99
99 -
 100
100 -
 101
101 -
 102
102 -
 103
103 -
104
-
105
-
106
-
107
-
108
-
109
-
110
-
111
-
112
-
113
-
114
-
115
-
116
-
117
-
118
-
119
-
120
-
121
-
122
-
123
-
124
-
125
-
126
-
127
-
128
-
129
-
130
-
131
-
132
-
133
-
134
-
135
-
136
-
137
-
138
-
139
-
140
-
141
-
142
-
143
-
144
-
145
-
146
-
147
-
148
-
149
-
150
-
151
-
152
-
153
-
154
 |
 |
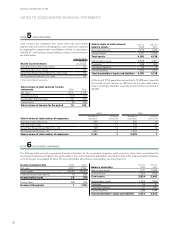
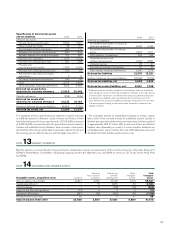
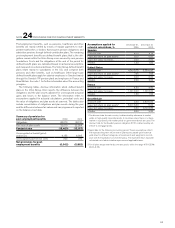
Changes in the Volvo Group’s holdings of shares and participations: 2009 2010
Balance sheet, December 31, preceding year 1,953 2,044
Change in Group structure (15) –
Acquisitions and divestments, net 45 104
Write-downs (48) (119)
Capital contribution 2 31
Share of income in associated companies 12 (75)
Revaluation of shares to fair value 92 148
Translation differences (74) 22
Dividends (21) (1)
Revaluation of holdings of Volvo Technology Transfer 80 –
Reclassifications – (42)
Other 18 (14)
Balance sheet, December 31 2,044 2,098
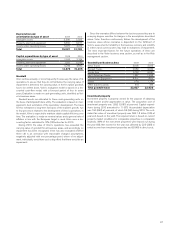
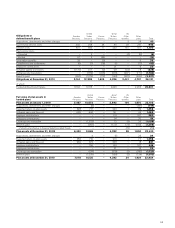
NOTE 16 NON-CURRENT CUSTOMER-FINANCING RECEIVABLES
2009 2010
Installment credits 18,517 15,673
Financial leasing 20,478 19,620
Other receivables 718 732
Total 39,713 36,025
Non-current customer-financing receivables maturities
2012 16,814
2013 11,668
2014 4,929
2015 2,120
2016 or later 494
Total 36,025
See notes 36 and 37 for financial instruments and goals and policies
in financial risk management.
NOTE 17 NON-CURRENT RECEIVABLES
2009 2010
Other interest-bearingloans to external parties 287 204
Other interest-bearing financial receivables 298 562
Other financial receivables 1,425 1,741
Other receivables 1,613 1,676
Total 3,623 4,184
Effective interest rate for non-current customer-financing receivables
was 6.54% as per December 31, 2010.
During 2010 SEK 4.1 billion, of which SEK 2.6 billion of the non-
current customer-financing receivables, in Brazil were sold as a risk
mitigation measure and to release capital for reinvestment in the
country.
See notes 36 and 37 for financial instruments and goals and policies in financial risk management.
89