Volvo 2010 Annual Report Download - page 98
Download and view the complete annual report
Please find page 98 of the 2010 Volvo annual report below. You can navigate through the pages in the report by either clicking on the pages listed below, or by using the keyword search tool below to find specific information within the annual report.-
 1
1 -
2
-
3
-
4
-
5
-
6
-
7
-
8
-
9
-
10
-
11
-
12
-
13
-
14
-
15
-
16
-
17
-
18
-
19
-
20
-
21
-
22
-
23
-
24
-
25
-
26
-
27
-
28
-
29
-
30
-
31
-
32
-
33
-
34
-
35
-
36
-
37
-
38
-
39
-
40
-
41
-
42
-
43
-
44
-
45
-
46
-
47
-
48
-
49
-
50
-
51
-
52
-
53
-
54
-
55
-
56
-
57
-
58
-
59
-
60
-
61
-
62
-
63
-
64
-
65
-
66
-
67
-
68
-
69
-
70
-
71
-
72
-
73
-
74
-
75
-
76
-
77
-
78
-
79
-
80
-
81
-
82
-
83
-
84
-
85
-
86
-
87
-
 88
88 -
 89
89 -
 90
90 -
 91
91 -
 92
92 -
 93
93 -
 94
94 -
 95
95 -
 96
96 -
 97
97 -
 98
98 -
 99
99 -
 100
100 -
 101
101 -
 102
102 -
 103
103 -
 104
104 -
 105
105 -
 106
106 -
 107
107 -
 108
108 -
109
-
110
-
111
-
112
-
113
-
114
-
115
-
116
-
117
-
118
-
119
-
120
-
121
-
122
-
123
-
124
-
125
-
126
-
127
-
128
-
129
-
130
-
131
-
132
-
133
-
134
-
135
-
136
-
137
-
138
-
139
-
140
-
141
-
142
-
143
-
144
-
145
-
146
-
147
-
148
-
149
-
150
-
151
-
152
-
153
-
154
 |
 |

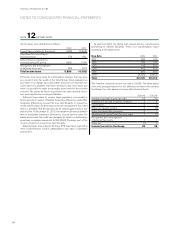
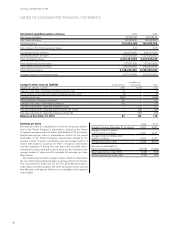
NOTES TO CONSOLIDATED FINANCIAL STATEMENTS
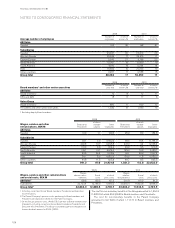
Pension costs 2009 2010
Current year service costs 969 896
Interest costs 1,684 1,510
Expected return on plan assets (1,362) (1,402)
Actuarial gains and losses1504 420
Past service costs
– Unvested 18 19
– Vested (314) 28
of which effect of agreement with UAW in Mack Trucks (317) –
Curtailments and settlements 36 (38)
Termination benefits 40 34
Pension costs for the period, defined-benefit plans 1,575 1,467
Pension costs for defined-contribution plans 3,116 3,273
Total pension costs for the period 4,691 4,740
1 For each plan, actuarial gains and losses are reported as income or expenses, when the accumulated amount exceeds the so called corridor. The income or
expenses are then recognized over the expected average remaining service period of the employees.
Costs for the period, post-employment benefits other than pensions 2009 2010
Current year service costs 270 49
Interest costs 334 170
Expected return on plan assets (1) –
Actuarial gains and losses14 (1)
Past service costs
– Unvested 7 –
– Vested 0 26
Curtailments and settlements 1,124 2
of which effect of agreement with UAW in Mack Trucks 1,194 –
Termination benefits 20 7
Total costs for the period, post-employment benefits other than pensions 1,758 253
1 For each plan, actuarial gains and losses are reported as income or expenses, when the accumulated amount exceed the so called corridor. The income or
expenses are then recognized over the expected average remaining service period of the employees.
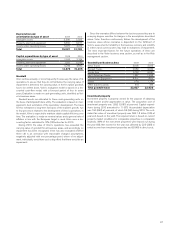
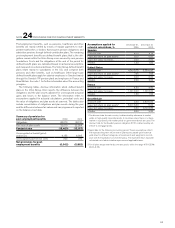
An increase of one percentage point per year in healthcare costs
would change the accumulated post-employment benefit obligation
as of December 31, 2010 by approximately 155, and the post-employ-
ment benefit expense for the period by approximately 10. A decrease
of one percentage point would decrease the accumulated value of
obligations by about 132 and reduce costs for the period by approxi-
mately 8. Calculations made as of December 31, 2010 show an annual
increase of 8% in the weighted average per capita costs of covered
health care benefits. It is assumed that the percentage will decline
gradually to 4.5% and then remain at that level.
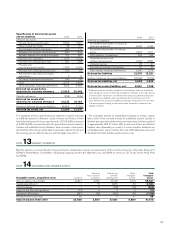
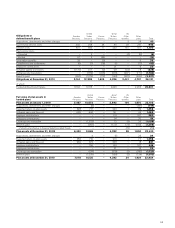
Obligations in
defined-benefit plans Sweden
Pensions
United
States
Pensions
France
Pensions
Great
Britain
Pensions
US
Other
benefits
Other
plans Total
Obligations at January 1, 2009 9,097 13,648 2,087 4,035 6,971 5,333 41,171
Acquisitions, divestments and other changes – – (53) – – (3) (56)
Current year service costs 323 264 65 52 252 283 1,239
Interest costs 414 774 104 242 328 168 2,030
Past service costs
– Unvested 1 (90) – – – – (89)
– Vested – (316) 3 – 5 – (308)
of which effect of agreement with UAW in Mack Trucks – (317) – – – – (317)
Termination benefits 32 – (1) – – 25 56
Curtailments and settlements (8) (18) – – (3,163) (140) (3,329)
of which effect of agreement with UAW in Mack Trucks – – – – 1,194 – 1,194
of which reclassification to financial liability in Mack Trucks – – – – (4,282) – (4,282)
Employee contributions – – – 24 – (1) 23
Actuarial (gains) and losses 321 1,096 18 187 231 (47) 1,806
Exchange rate translation – (1,008) (110) 73 (320) (148) (1,513)
Benefits paid (299) (992) (216) (175) (607) (671) (2,960)
Obligations at December 31, 2009 9,881 13,358 1,897 4,438 3,697 4,799 38,070
of which
Funded defined-benefit plans 9,465 12,923 – 4,438 – 2,277 29,103
FINANCIAL INFORMATION 2010
94