Volvo 2010 Annual Report Download - page 64
Download and view the complete annual report
Please find page 64 of the 2010 Volvo annual report below. You can navigate through the pages in the report by either clicking on the pages listed below, or by using the keyword search tool below to find specific information within the annual report.-
 1
1 -
2
-
3
-
4
-
5
-
6
-
7
-
8
-
9
-
10
-
11
-
12
-
13
-
14
-
15
-
16
-
17
-
18
-
19
-
20
-
21
-
22
-
23
-
24
-
25
-
26
-
27
-
28
-
29
-
30
-
31
-
32
-
33
-
34
-
35
-
36
-
37
-
38
-
39
-
40
-
41
-
42
-
43
-
44
-
45
-
46
-
47
-
48
-
49
-
50
-
51
-
52
-
53
-
 54
54 -
 55
55 -
 56
56 -
 57
57 -
 58
58 -
 59
59 -
 60
60 -
 61
61 -
 62
62 -
 63
63 -
 64
64 -
 65
65 -
 66
66 -
 67
67 -
 68
68 -
 69
69 -
 70
70 -
 71
71 -
 72
72 -
 73
73 -
 74
74 -
75
-
76
-
77
-
78
-
79
-
80
-
81
-
82
-
83
-
84
-
85
-
86
-
87
-
88
-
89
-
90
-
91
-
92
-
93
-
94
-
95
-
96
-
97
-
98
-
99
-
100
-
101
-
102
-
103
-
104
-
105
-
106
-
107
-
108
-
109
-
110
-
111
-
112
-
113
-
114
-
115
-
116
-
117
-
118
-
119
-
120
-
121
-
122
-
123
-
124
-
125
-
126
-
127
-
128
-
129
-
130
-
131
-
132
-
133
-
134
-
135
-
136
-
137
-
138
-
139
-
140
-
141
-
142
-
143
-
144
-
145
-
146
-
147
-
148
-
149
-
150
-
151
-
152
-
153
-
154
 |
 |

BOARD OF DIRECTORS’ REPORT 2010
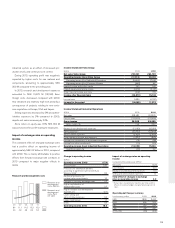
Income Statement Customer Finance
SEK M 2009 2010
Finance and lease income 11,712 9,031
Finance and lease expenses (8,427) (5,974)
Gross income 3,285 3,057
Selling and administrative expenses (1,608) (1,526)
Credit provision expenses (2,327) (1,438)
Other operating income and expenses (30) 73
Operating income (loss) (680) 167
Income taxes 114 (134)
Income (Loss) for the period (566) 32
Return on Equity (6.2) 0.4
Customer Finance Operations
Total new financing volume in 2010 amounted to
SEK 35 billion (29). Adjusted for changes in
exchange rates, new business volume increased
by 26% compared to 2009 as a result of
increased sales volumes of the Volvo Group prod-
ucts and good penetration levels. In total, 34,522
new vehicles and machines (25,782) were
financed during the year. In the markets where
financing is offered, the average penetration rate
was 25% (25).
At December 31, 2010, total assets amounted
to SEK 89 billion (99). During 2010 the credit
portfolio decreased by 4.4% (decrease: 15.6),
adjusted for exchange-rate movements, to gross
credit portfolio SEK 84,550 M (94,988). The
funding of the credit portfolio is matched in terms
of maturity, interest rates and currencies in
accordance with Volvo Group policy. For further
information see note 36.
The operating income for the year amounted to
SEK 167 M compared to operating loss of SEK
680 M in the previous year. Return on sharehold-
ers’ equity was 0.4% (neg: 6.2). The equity ratio
at the end of the year was 9.0% (8.7). The
income is driven mainly by lower credit provisions.
During the year, credit provision expenses
amounted to SEK 1,438 M (2,327) while write-
offs of SEK 1,460 M (2,223) were recorded. The
write-off ratio for 2010 was 1.65% (2.09). At the
end of December 31, 2010, credit reserves were
1.69% (1.67%) of the credit portfolio.
Customer Finance12009 2010
Credit portfolio net, SEK bn 93.5 83.1
Operating income, SEK M (680) 167
Return on shareholders' equity, % (6.2) 0.4
Total penetration rate, % 24.8 24.5
Penetration by business area, %
Volvo CE 34 35
Volvo Trucks 30 29
Renualt Trucks 20 17
MackTrucks 14 20
Buses 16 11
UD Trucks 4 12
1 Share of business financed by Volvo Financial Services in
markets where financial services are offered.
Key ratios
60