Volvo 2010 Annual Report Download - page 138
Download and view the complete annual report
Please find page 138 of the 2010 Volvo annual report below. You can navigate through the pages in the report by either clicking on the pages listed below, or by using the keyword search tool below to find specific information within the annual report.-
 1
1 -
2
-
3
-
4
-
5
-
6
-
7
-
8
-
9
-
10
-
11
-
12
-
13
-
14
-
15
-
16
-
17
-
18
-
19
-
20
-
21
-
22
-
23
-
24
-
25
-
26
-
27
-
28
-
29
-
30
-
31
-
32
-
33
-
34
-
35
-
36
-
37
-
38
-
39
-
40
-
41
-
42
-
43
-
44
-
45
-
46
-
47
-
48
-
49
-
50
-
51
-
52
-
53
-
54
-
55
-
56
-
57
-
58
-
59
-
60
-
61
-
62
-
63
-
64
-
65
-
66
-
67
-
68
-
69
-
70
-
71
-
72
-
73
-
74
-
75
-
76
-
77
-
78
-
79
-
80
-
81
-
82
-
83
-
84
-
85
-
86
-
87
-
88
-
89
-
90
-
91
-
92
-
93
-
94
-
95
-
96
-
97
-
98
-
99
-
100
-
101
-
102
-
103
-
104
-
105
-
106
-
107
-
108
-
109
-
110
-
111
-
112
-
113
-
114
-
115
-
116
-
117
-
118
-
119
-
120
-
121
-
122
-
123
-
124
-
125
-
126
-
127
-
 128
128 -
 129
129 -
 130
130 -
 131
131 -
 132
132 -
 133
133 -
 134
134 -
 135
135 -
 136
136 -
 137
137 -
 138
138 -
 139
139 -
 140
140 -
 141
141 -
 142
142 -
 143
143 -
 144
144 -
 145
145 -
 146
146 -
 147
147 -
 148
148 -
149
-
150
-
151
-
152
-
153
-
154
 |
 |
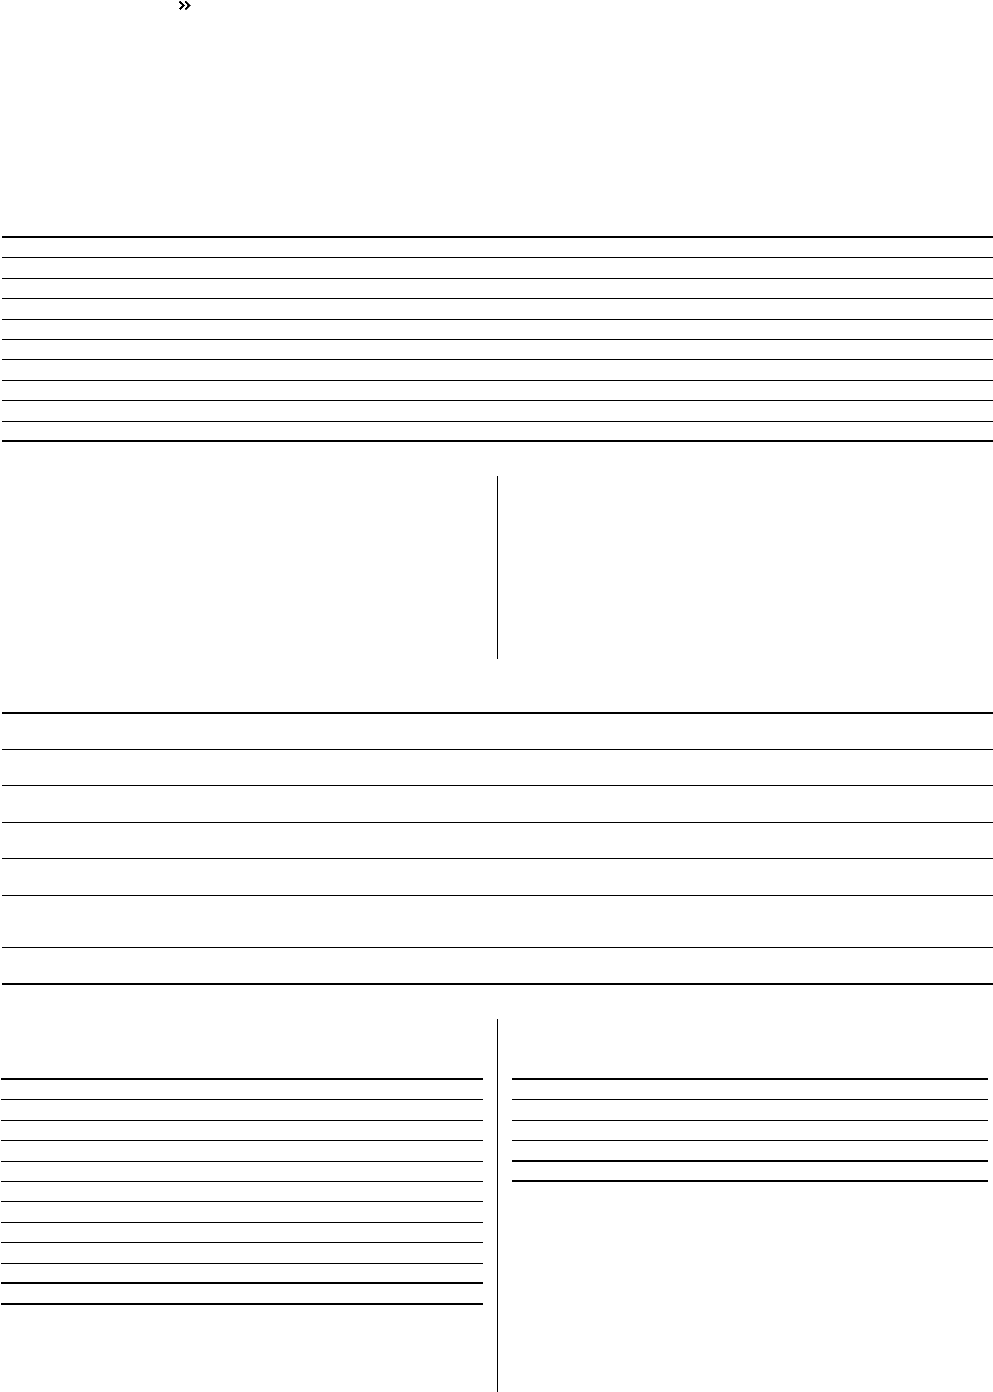
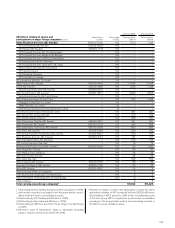
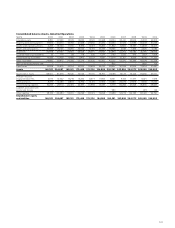
ELEVEN-YEAR SUMMARY
Volvo share statistics
Data per share (adjusted for issues and splits)1
2000 2001 2002 2003 2004 2005 2006 2007 2008 2009 2010
Basic earnings, SEK12.24 (0.70) 0.66 0.14 4.72 6.44 8.03 7.37 4.90 (7.26) 5.36
Cash dividend, SEK 1.60 1.60 1.60 1.60 2.50 3.35 10.0095.50 2.00 0 2.5010
Share price at year-end, SEK (B share) 31.30 35.20 28.40 43.70 52.70 74.90 90.70 108.50 42.90 61.45 118.50
Direct return, % (B share) 25.1 4.5 5.6 10.584.7 4.5 11.0 5.1 4.7 – 2.1
Effective return, % (B share)3(23) 17.6 (14.8) 71.2 25.5 48.5 39.8 25.7 (59) 43 97
Price/earnings ratio (B share)414 neg 43 310 11.2 11.6 11.3 14.7 8.8 neg 22.1
EBIT multiple510 25 23 14 9.2 9.3 10.3 9.7 3.6 neg 12.0
Payout ratio, %671 neg 242 1,143 53 52 62 75 41 – 47
Shareholders’ equity, SEK744.40 40.60 37.40 34.60 34 38.80 43 41 41 33 36
Return on shareholders’ equity 5.0 neg 1.7 0.4 13.9 17.8 19.6 18.1 12.1 neg 16.0
Other share data 2000 2001 2002 2003 2004 2005 2006 2007 2008 2009 2010
Number of shareholders
at year-end 230,000 214,000 211,000 208,500 202,300 195,442 183,735 197,519 220,192 233,311 240,043
Number of Series A shares out-
standing at year-end, million 124.7 131.7 131.7 131.7 131.5 131.4 131.4 657 657 657 657
Number of Series B shares
outstanding at year-end, million 272.6 287.8 287.8 287.8 278.6 273.1 273.4 1,369 1,371 1,371 1,371
Average number of shares out-
standing, million 421.7 422.4 419.4 419.4 418.5 405.2 404.7 2,025 2,027 2,027 2,027
Number of Series A shares traded in
Stockholm during the year, million 42.4 40.3 27.3 31.4 42.0 39.3 56.4 172.3 308.0 147.0 203.2
Number of Series B shares
traded in Stockholm during the
year, million 391.2 344.4 349.4 404.8 498.0 518.7 617.0 2,712.4 3,130.0 2,713.9 2,272.4
Number of shares traded in ADR,
NASDAQ during the year, million 16.0 15.0 11.0 10.4 24.0 19.8 14.1 113.5 – – –
1 Basic earnings per share is calculated as income for the period divided
by average number of shares outstanding. Reporting according to IFRS
from 2004.
2 Proposed dividend in SEK per share divided by share price at year-end.
3 Share price at year-end, including proposed dividend during the year,
divided by share price at beginning of the year, (2000 includes premium
in connection with repurchase, 2003 includes distribution of shares in
Ainax, 2006 includes a share split 6:1 in which the sixth share was
redeemed by AB Volvo for an amount of SEK 5.00 per share).
4 Share price at year-end divided by basic earnings per share.
5 Market value at year-end minus net financial position and minority inter-
ests divided by operating income excluding restructuring costs and
revaluation of shares.
6 Cash dividend divided by basic earnings per share.
7 Shareholders’ equity for shareholders in AB Volvo divided by number of
shares outstanding at year-end.
8 Including distribution of shares in Ainax equal to SEK 3.01 (share-split
adjusted) per Volvo share in 2004.
9 Including extra payment of SEK 5 through redemption of shares.
10 Proposed by the Board of Directors.
The largest shareholders in AB Volvo, December 31, 20101
Number of
shares
% of total
votes
Share
capital, %
Renault s.a.s. 138,604,945 17.5 6.8
Industrivärden 92,445,434 11.1 4.6
Violet Partners LP 43,727,400 5.5 2.2
SHB246,454,585 4.8 2.3
AMF Insurance & Funds 56,042,500 3.9 2.8
AFA Insurance 29,136,945 3.5 1.4
Alecta (pension funds) 69,725,000 3.5 3.4
Swedbank Robur Funds 90,469,158 3.5 4.5
SEBFunds/Trygg Life Insurance 50,605,131 2.6 2.5
Skandia Liv 21,619,796 2.5 1.1
Total 638,830,894 58.4 31.6
Distribution of shares, December 31, 20101
Volvo shareholders
Number of
shareholders
% of total
votes1
Share of
capital, %1
1–1,000 shares 182,716 2.3 2.8
1,001–10,000 shares 52,572 5.4 7.3
10,001–100,000 shares 4,050 3.1 4.8
100,001– 703 89.2 85.1
Total 240,043 100.0 100.0
1 Based on the number of outstanding shares.
2 Comprises shares held by SHB, SHB Pension Fund, SHB Employee Fund,
SHB Pensionskassa and Oktogonen.
1 Based on all registered shares.
AB Volvo held 4.7% of the Company’s shares on December 31, 2010.
FINANCIAL INFORMATION 2010
134