Volvo 2010 Annual Report Download - page 102
Download and view the complete annual report
Please find page 102 of the 2010 Volvo annual report below. You can navigate through the pages in the report by either clicking on the pages listed below, or by using the keyword search tool below to find specific information within the annual report.-
 1
1 -
2
-
3
-
4
-
5
-
6
-
7
-
8
-
9
-
10
-
11
-
12
-
13
-
14
-
15
-
16
-
17
-
18
-
19
-
20
-
21
-
22
-
23
-
24
-
25
-
26
-
27
-
28
-
29
-
30
-
31
-
32
-
33
-
34
-
35
-
36
-
37
-
38
-
39
-
40
-
41
-
42
-
43
-
44
-
45
-
46
-
47
-
48
-
49
-
50
-
51
-
52
-
53
-
54
-
55
-
56
-
57
-
58
-
59
-
60
-
61
-
62
-
63
-
64
-
65
-
66
-
67
-
68
-
69
-
70
-
71
-
72
-
73
-
74
-
75
-
76
-
77
-
78
-
79
-
80
-
81
-
82
-
83
-
84
-
85
-
86
-
87
-
88
-
89
-
90
-
91
-
 92
92 -
 93
93 -
 94
94 -
 95
95 -
 96
96 -
 97
97 -
 98
98 -
 99
99 -
 100
100 -
 101
101 -
 102
102 -
 103
103 -
 104
104 -
 105
105 -
 106
106 -
 107
107 -
 108
108 -
 109
109 -
 110
110 -
 111
111 -
 112
112 -
113
-
114
-
115
-
116
-
117
-
118
-
119
-
120
-
121
-
122
-
123
-
124
-
125
-
126
-
127
-
128
-
129
-
130
-
131
-
132
-
133
-
134
-
135
-
136
-
137
-
138
-
139
-
140
-
141
-
142
-
143
-
144
-
145
-
146
-
147
-
148
-
149
-
150
-
151
-
152
-
153
-
154
 |
 |

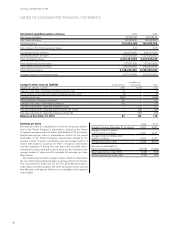
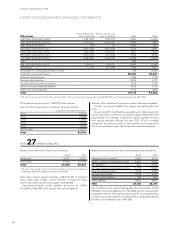
NOTES TO CONSOLIDATED FINANCIAL STATEMENTS
Other loans Actual interest rate,
Dec 31, 2010, %
Effective interest rate,
Dec 31, 2010, % 2009 2010
USD 2007–2010/2012–2018 0.52–7.50 0.52–7.76 17,281 13,433
EUR 2004–2009/2012–2027 3.25–6.50 3.28–6.50 5,995 1,485
GBP 2008/2012–2013 1.19 1.2 1,664 337
SEK 2007–2010/2012–2017 2.00–3.00 2.02–3.00 1,915 2,942
CAD 2006–2010/2012–2013 1.53–2.84 1.54–2.87 2,067 2,928
MXN 2007–2009/2012–2014 5.00–9.04 5.11–9.42 2,145 2,186
JPY 2005–2010/2012–2016 0.65–3.52 0.65–3.52 16,374 12,405
CHF 696 –
BRL 2003–2009/2012–2017 6.58–7.0 6.86–7.0 5,940 5,348
Other loans 1.7–7.5 1.71–7.64 1,189 1,871
Revaluation of outstanding derivaties to SEK 769 2,392
Total other non-current loans2 56,035 45,327
Deferred leasing income 1,965 1,778
Residual value liabilities 3,109 3,170
Accrued expenses service contracts 1,422 1,273
Other non-current financial liabilities 1,672 1,114
Other non-current liabilities 1,720 1,896
Total 115,114 93,325
2 Of which loans raised to finance the credit portfolio of the customer financing operations 21,064 (26,551) and financial derivatives 2.392 (769).
Of the above long-term loans, 1,288 (270) was secured.
See note 28 for a description of changes of assets pledged.
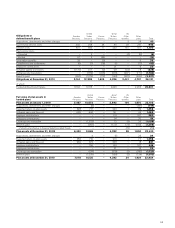
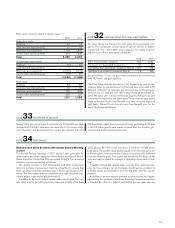
Long-term loans mature as follows:
2012 23,530
2013 13,836
2014 17,591
2015 10,190
2016 6,476
2017 or later 12,471
Total 84,094
See note 16 for maturities of long-term customer financing receivables.
Of other non-current liabilities the majority will mature within five
years.
At year-end 2010, credit facilities granted but not utilized and which
can be used without restrictions amounted to approximately SEK 35.3
billion (33.2). These facilities consisted of stand-by facilities for loans
with varying maturities through the year 2013. A fee is normally
charged for the unused portion of credit facilities and is reported in
the income statement under other financial income and expenses.
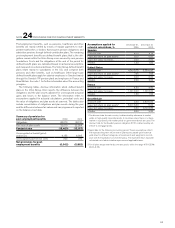
NOTE 27CURRENT LIABILITIES
Balance sheet amounts for loans were as follows:
2009 2010
Bank loans 14,083 12,261
Other loans 37,543 27,340
Total151,626 39,601
1 Of which loans raised to finance the credit portfolio of the customer financing
operations 29,690 (40,766) and derivatives 458 (178).
Bank loans include current maturities, 3,246 (4,713), of long-term
loans. Other loans include current maturities of long-term loans,
22,007 (25,108), and commercial paper, 1,416 (8,640).
Non-interest-bearing current liabilities accounted for 84,457
(70,955), or 68% (58) of the Group’s total current liabilities.
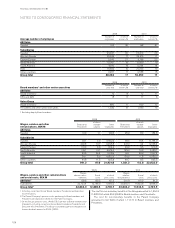
Balance sheet amounts for other current liabilities were as follows:
2009 2010
Advances from customers 3,556 3,416
Wages, salaries and withholding taxes 8,504 8,824
VAT liabilities 1,511 2,023
Accrued expenses and prepaid income 11,756 12,626
Deferred leasing income 1,725 1,640
Residual value liability 2,730 2,154
Other financial liabilities 783 242
Other liabilities 3,540 4,416
Total 34,105 35,341
Current liabilities also include trade payables that amounted to 47,250
(35,955), current tax liabilities of 1,732 (623) and non interest-bear-
ing liabilities held for sale reported within Note 4. Secured bank loans
at year-end 2010 amounted to 216 (329). The corresponding amount
for other current liabilities was 1,442 (58).
FINANCIAL INFORMATION 2010
98