Volvo 2010 Annual Report Download - page 72
Download and view the complete annual report
Please find page 72 of the 2010 Volvo annual report below. You can navigate through the pages in the report by either clicking on the pages listed below, or by using the keyword search tool below to find specific information within the annual report.
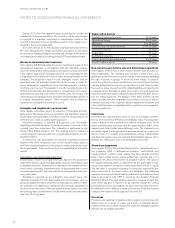
CONSOLIDATED BALANCE SHEET
SEK M December 31, 2009 December 31, 2010
Assets
Non-current assets
Intangible assets Note 14 41,628 40,714
Tangible assets Note 14
Property, plant and equipment 54,289 53,294
Investment property 991 948
Assets under operating leases 20,388 75,668 19,647 73,889
Financial assets
Associated companies Note 15 588 684
Other sharesand participations Note 15 1,456 1,414
Non-current customer-financing receivables Note 16 39,713 36,025
Deferred tax assets Note 12 12,595 12,310
Prepaid pensions Note 24 2,049 1,648
Non-current interest-bearing receivables Note 17 585 766
Other non-current receivables Note 17 3,038 60,024 3,418 56,265
Total non-current assets 177,320 170,868
Current assets
Inventories Note 18 37,727 39,837
Current receivables
Customer-financing receivables Note 19 42,264 36,663
Tax assets 1,523 1,135
Interest-bearing receivables Note 20 410 342
Accounts receivable Note 20 21,337 24,433
Other receivables Note 20 12,082 11,857
Non interest-bearing assets held for sale Note 4 1,684 136
Interest-bearing assets held for sale 8 79,308 0 74,566
Marketable securities Note 21 16,676 9,767
Cash and cash equivalents Note 22 21,234 22,966
Total current assets 154,945 147,139
Total assets 332,265 318,007
Shareholders’ equity and liabilities
Shareholders’ equity Note 23
Share capital 2,554 2,554
Additional contributed capital – –
Reserves 6,235 2,386
Retained earnings 72,334 57,304
Income for the period (14,718) 10,866
Equity attributable to the equity holders of the Parent Company 66,405 73,110
Minority interests 629 1,011
Total shareholders’ equity 67,034 74,121
Non-current provisions
Provisions for post-employmentbenefits Note 24 8,051 7,510
Provisions for deferred taxes Note 12 3,638 4,522
Other provisions Note 25 6,360 18,049 5,936 17,968
Non-current liabilities Note 26
Bond loans 49,191 38,767
Other loans 56,035 45,327
Other liabilities 9,888 115,114 9,231 93,325
Current provisions Note 25 9,487 8,534
Current liabilities Note 27
Loans 51,626 39,601
Non interest-bearing liabilities held for sale Note 4 272 135
Trade payables 35,955 47,250
Tax liabilities 623 1,732
Other liabilities 34,105 122,581 35,341 124,059
Total shareholders’ equity and liabilities 332,265 318,007
Assets pledged Note 28 958 3,339
Contingent liabilities Note 29 9,607 11,003
FINANCIAL INFORMATION 2010
68


