Volvo 2010 Annual Report Download - page 66
Download and view the complete annual report
Please find page 66 of the 2010 Volvo annual report below. You can navigate through the pages in the report by either clicking on the pages listed below, or by using the keyword search tool below to find specific information within the annual report.-
 1
1 -
2
-
3
-
4
-
5
-
6
-
7
-
8
-
9
-
10
-
11
-
12
-
13
-
14
-
15
-
16
-
17
-
18
-
19
-
20
-
21
-
22
-
23
-
24
-
25
-
26
-
27
-
28
-
29
-
30
-
31
-
32
-
33
-
34
-
35
-
36
-
37
-
38
-
39
-
40
-
41
-
42
-
43
-
44
-
45
-
46
-
47
-
48
-
49
-
50
-
51
-
52
-
53
-
54
-
55
-
 56
56 -
 57
57 -
 58
58 -
 59
59 -
 60
60 -
 61
61 -
 62
62 -
 63
63 -
 64
64 -
 65
65 -
 66
66 -
 67
67 -
 68
68 -
 69
69 -
 70
70 -
 71
71 -
 72
72 -
 73
73 -
 74
74 -
 75
75 -
 76
76 -
77
-
78
-
79
-
80
-
81
-
82
-
83
-
84
-
85
-
86
-
87
-
88
-
89
-
90
-
91
-
92
-
93
-
94
-
95
-
96
-
97
-
98
-
99
-
100
-
101
-
102
-
103
-
104
-
105
-
106
-
107
-
108
-
109
-
110
-
111
-
112
-
113
-
114
-
115
-
116
-
117
-
118
-
119
-
120
-
121
-
122
-
123
-
124
-
125
-
126
-
127
-
128
-
129
-
130
-
131
-
132
-
133
-
134
-
135
-
136
-
137
-
138
-
139
-
140
-
141
-
142
-
143
-
144
-
145
-
146
-
147
-
148
-
149
-
150
-
151
-
152
-
153
-
154
 |
 |
BOARD OF DIRECTORS’ REPORT 2010
Volvo Group’s liquid funds, cash and cash equiva-
lents and marketable securities combined,
amounted to SEK 32.7 billion on December 31,
2010. Of this, SEK 0.7 billion was restricted for
use by the Volvo Group and SEK 7.4 billion con-
sisted of liquid funds in countries where exchange
controls or other legal restrictions apply. In add-
ition to this, granted but unutilized credit facilities
amounted to SEK 35.3 billion.
Total assets in the Group amounted to SEK 318,0
billion on December 31, 2010, a decrease of SEK
14.3 billion compared to year-end 2009. Fluctu-
ations in currency decreased the total assets by SEK
12.9 billion during 2010. Other changes are mainly a
result of higher working capital due to increased
inventories, accounts receivable and account pay-
able offset by decreased customer financing receiv-
ables due to lower levels of financial leasing, install-
ment credits and dealer financing as well as
fluctuations in currency.
The Group’s intangible assets amounted to SEK
40.7 billion on December 31, 2010. Investments in
research and development amounted to SEK 3.2 bil-
lion in 2010, resulting in a net value of development
costs of SEK 11.6 billion at the end of the year. The
Group’s total goodwill amounted to SEK 22.9 billion
on December 31, 2010, a decrease by SEK 0.9 bil-
lion compared to year-end 2009. The decrease is a
result of fluctuations in currency. The tangible assets
decreased by SEK 1.8 billion during 2010, mainly as
a result of divesture of subsidiaries.
The value of the inventories increased by SEK 2.1
billion during 2010. The increase is mainly related to
finished products within the truck operations and
construction equipment. Currency fluctuations
decreased the value of inventories by SEK 1.8 billion
at the end of 2010.
The net value of assets and liabilities related to
pensions and similar obligations amounted to SEK
5.9 billion on December 31, 2010, a decrease of
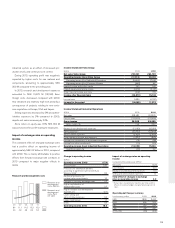
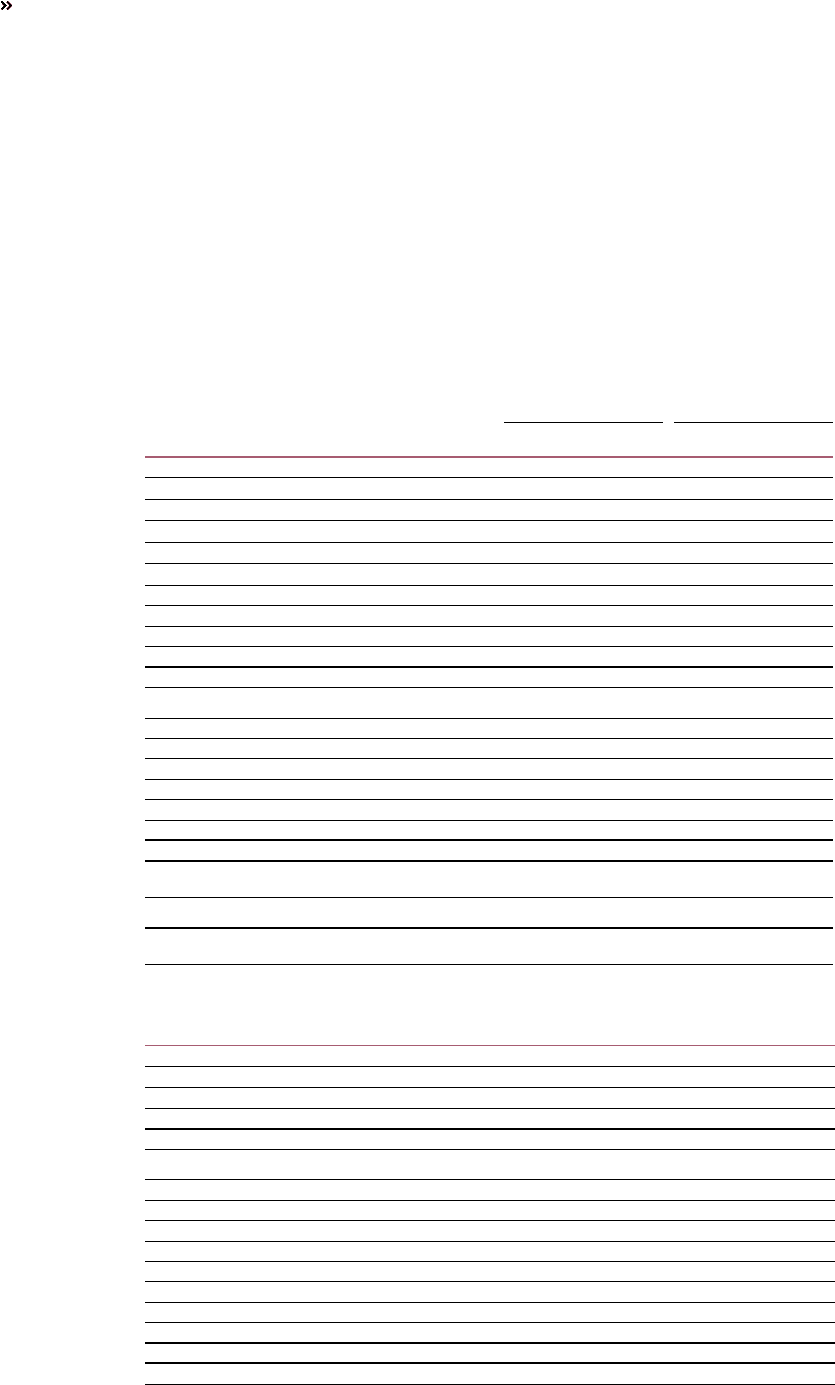
Net financial position
Industrial Operations Volvo Group
SEK M
Dec 31
2009
Dec 31
2010
Dec 31
2009
Dec 31
2010
Non-currentinterest-bearing assets
Non-current customer-financing receivables – – 39,713 36,025
Non-current interest-bearing receivables 1,095 941 585 766
Currentinterest-bearing assets
Customer-financing receivables – – 42,264 36,663
Interest-bearing receivables 1,215 1,071 410 342
Internal funding 3,662 7,505 – –
Interest-bearing assets held for sale 8 0 8 0
Marketable securities 16,655 9,735 16,676 9,767
Cash and bank 20,749 21,756 21,234 22,966
Total financial assets 43,384 41,008 120,890 106,529
Non-currentinterest-bearing liabilities
Bond loans 49,191 38,767 49,191 38,767
Other loans 48,684 37,180 56,035 45,327
Internal funding (30,908) (26,971) – –
Currentinterest-bearing liabilities
Loans 44,196 32,101 51,626 39,601
Internal funding (32,273) (21,220) – –
Total financial liabilities 78,890 59,857 156,852 123,695
Net financial position excl.
post employment benefits (35,506) (18,849) (35,962) (17,166)
Provision for post employment benefits, net 5,983 5,842 6,002 5,862
Net financial position incl.
post employment benefits (41,489) (24,691) (41,964) (23,028)
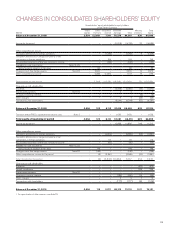
Change in net financial position, Industrial Operations
SEK bn 2009 2010
Beginning of period (29.8) (41.5)
Cash flow from operating activities (1.6) 28.8
Investments in fixed assets (to)/from (10.5) (10.6)
Disposals 0.7 0.8
Operating cash-flow (11.4) 19.0
Investments and divestments of shares 0.0 (0.1)
Acquired and divested operations, net 0.2 0.2
Capital injections (to)/from Customer Finance Operations 0.4 (0.5)
Currency effect 3.0 (1.6)
Payment to AB Volvo shareholders (4.1) –
Revaluation of loans 0.9 –
Provision UAW agreement (0.9) –
Dividend paid to minority shareholders 0.0 (0.1)
Other 0.2 (0.1)
Total change (11.7) 16.8
Net financial position at end of period (41.5) (24.7)
FINANCIAL POSITION
Improved during the year
Net debt in the Volvo Group’s Industrial Operations amounted to SEK 24.7 billion at December 31, 2010, equal to 37.4%
of shareholders’ equity. Excluding provisions for post-employment benefits the Volvo Group’s net debt amounted to SEK
18.8 billion, which was equal to 28.5% of shareholders’ equity.
62