Volvo 2010 Annual Report Download - page 68
Download and view the complete annual report
Please find page 68 of the 2010 Volvo annual report below. You can navigate through the pages in the report by either clicking on the pages listed below, or by using the keyword search tool below to find specific information within the annual report.-
 1
1 -
2
-
3
-
4
-
5
-
6
-
7
-
8
-
9
-
10
-
11
-
12
-
13
-
14
-
15
-
16
-
17
-
18
-
19
-
20
-
21
-
22
-
23
-
24
-
25
-
26
-
27
-
28
-
29
-
30
-
31
-
32
-
33
-
34
-
35
-
36
-
37
-
38
-
39
-
40
-
41
-
42
-
43
-
44
-
45
-
46
-
47
-
48
-
49
-
50
-
51
-
52
-
53
-
54
-
55
-
56
-
57
-
 58
58 -
 59
59 -
 60
60 -
 61
61 -
 62
62 -
 63
63 -
 64
64 -
 65
65 -
 66
66 -
 67
67 -
 68
68 -
 69
69 -
 70
70 -
 71
71 -
 72
72 -
 73
73 -
 74
74 -
 75
75 -
 76
76 -
 77
77 -
 78
78 -
79
-
80
-
81
-
82
-
83
-
84
-
85
-
86
-
87
-
88
-
89
-
90
-
91
-
92
-
93
-
94
-
95
-
96
-
97
-
98
-
99
-
100
-
101
-
102
-
103
-
104
-
105
-
106
-
107
-
108
-
109
-
110
-
111
-
112
-
113
-
114
-
115
-
116
-
117
-
118
-
119
-
120
-
121
-
122
-
123
-
124
-
125
-
126
-
127
-
128
-
129
-
130
-
131
-
132
-
133
-
134
-
135
-
136
-
137
-
138
-
139
-
140
-
141
-
142
-
143
-
144
-
145
-
146
-
147
-
148
-
149
-
150
-
151
-
152
-
153
-
154
 |
 |

BOARD OF DIRECTORS’ REPORT 2010
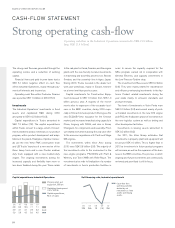
The strong cash flow was generated through the
operating income and a reduction of working
capital.
Financial items and paid income taxes had a
SEK 5.1 billion negative effect on cash flow
within Industrial Operations, mainly through pay-
ments of interests and income tax.
Operating cash flow within Customer Finance
was a positive SEK 1.4 billion in 2010 (15.1).
Investments
The Industrial Operations’ investments in fixed
assets and capitalized R&D during 2010
amounted to SEK 10.3 billion (10.3).
Capital expenditures in Trucks amounted to
SEK 7.2 billion (7.4). The capital expenditures
within Trucks consist to a large extent of invest-
ments related to product renewals in our product
program, within product development and adap-
tations in the plants. Examples of product renew-
als are the new Volvo FMX construction truck
and UD Trucks’ launches of a new version of the
Quon heavy truck and a new Condor medium
duty truck equipped with a new medium-duty
engine. The ongoing investments aiming for
increased capacity and flexibility have more or
less been finalized during the year. Those relate
to the cab plant in Umeå, Sweden, and the engine
plants with the new foundry but also investments
in machining and assembly processes in Skövde,
Sweden, and the assembly line in Ageo, Japan.
During 2010, Trucks invested in the dealer net-
work and workshops, mainly in Europe, however
on a lower level than previous year.
Capital investments for Construction Equip-
ment increased to SEK 1.4 billion from SEK 1.0
billion previous year. A majority of the invest-
ments refer to expansion of the excavator busi-
ness in the BRIC countries, during 2010 espe-
cially in China. It includes product offerings as the
new EC200B Volvo excavator for the Chinese
market, and increased manufacturing capacity in
China, Lingong with SDLG, and also in Korea,
Changwon, for components and assembly. Prod-
uct related investments during the year also refer
to the emission regulations with Tier4i and Stage
IIIB engines.
The investments within Volvo Aero during
2010 were SEK 0.8 billion (0.6). The majority of
the investments refer to the involvement in the
new engine programs, PW1000G with Pratt &
Whitney, and Trent XWB with Rolls-Royce. The
investments also refer to finalization of a number
of investments in Aero’s production facilities in
order to secure the capacity required for the
GEnx program, carried out in cooperation with
General Electrics, and capacity investments in
the Low Pressure Turbine shop.
The investments in Buses were SEK 0.2 billion
(0.4). They were mainly related to maintenance
and efficiency-enhancing investments in the fac-
tories. Product related investments during the
year relate mainly to emission standards and
product renewals.
The level of investments in Volvo Penta were
SEK 0.2 billion (0.3) and consist mainly of prod-
uct-related investments in the new D13 engine
and IPS3, the finalization phase of investments in
the new logistics system as well as tooling and
other development activities.
Investments in leasing assets amounted to
SEK 0.3 billion (0.2).
For 2011, the Volvo Group estimates that
investments in property, plant and equipment will
be around SEK 10 billion. This is higher than in
2010 as investments in future product programs
will increase, as well as the expansion of the busi-
ness in the BRIC countries. The process in which
ongoing and future investments are continuously
reviewed and prioritized is still in focus.
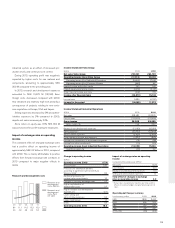
Capital expenditures, Industrial Operations
Capitalized development
costs, SEK bn
Capital expenditures,
% of net sales
10090807
2.62.12.12.9
5.04.33.63.9
7.710.58.06.8
Property, plant and
equipment, SEK bn
06
3.2
4.0
7.1
Self-financing ratio, Industrial operations %
Cash-flow from
operating activities
divided by net
investments in fixed
assets and leasing
assets.
1009080706
294(16)78265235
CASH-FLOW STATEMENT
Strong operating cash-flow
Operating cash flow in the Industrial Operations amounted to SEK 19.0 billion
(neg: SEK 11.4 billion).
64