Volvo 2010 Annual Report Download - page 140
Download and view the complete annual report
Please find page 140 of the 2010 Volvo annual report below. You can navigate through the pages in the report by either clicking on the pages listed below, or by using the keyword search tool below to find specific information within the annual report.-
 1
1 -
2
-
3
-
4
-
5
-
6
-
7
-
8
-
9
-
10
-
11
-
12
-
13
-
14
-
15
-
16
-
17
-
18
-
19
-
20
-
21
-
22
-
23
-
24
-
25
-
26
-
27
-
28
-
29
-
30
-
31
-
32
-
33
-
34
-
35
-
36
-
37
-
38
-
39
-
40
-
41
-
42
-
43
-
44
-
45
-
46
-
47
-
48
-
49
-
50
-
51
-
52
-
53
-
54
-
55
-
56
-
57
-
58
-
59
-
60
-
61
-
62
-
63
-
64
-
65
-
66
-
67
-
68
-
69
-
70
-
71
-
72
-
73
-
74
-
75
-
76
-
77
-
78
-
79
-
80
-
81
-
82
-
83
-
84
-
85
-
86
-
87
-
88
-
89
-
90
-
91
-
92
-
93
-
94
-
95
-
96
-
97
-
98
-
99
-
100
-
101
-
102
-
103
-
104
-
105
-
106
-
107
-
108
-
109
-
110
-
111
-
112
-
113
-
114
-
115
-
116
-
117
-
118
-
119
-
120
-
121
-
122
-
123
-
124
-
125
-
126
-
127
-
128
-
129
-
 130
130 -
 131
131 -
 132
132 -
 133
133 -
 134
134 -
 135
135 -
 136
136 -
 137
137 -
 138
138 -
 139
139 -
 140
140 -
 141
141 -
 142
142 -
 143
143 -
 144
144 -
 145
145 -
 146
146 -
 147
147 -
 148
148 -
 149
149 -
 150
150 -
151
-
152
-
153
-
154
 |
 |

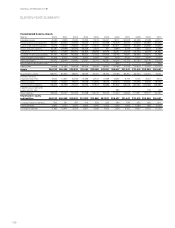
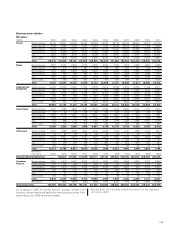
ELEVEN-YEAR SUMMARY
Operating income
SEK M 2000 200142002 20033200422005 200612007 2008 2009 2010
Trucks51,414 (2,066) 1,189 3,951 8,992 11,717 13,116 15,193 12,167 (10,805) 10,112
Buses 440 (916) (94) (790) 158 470 745 231 (76) (350) 780
Construction Equipment 1,594 527 406 908 1,898 2,752 4,072 4,218 1,808 (4,005) 6,180
Volvo Penta 484 658 647 695 940 943 1,105 1,173 928 (230) 578
Volvo Aero 621 653 5 (44) 403 836 359 529 359 50 286
Customer Finance 1,499 325 490 926 1,365 2,033 1,686 1,649 1,397 (680) 167
Other 616 143 194 (3,142) 923 (598) (684) (762) (731) (994) (102)
Operating income
(loss) Volvo Group 6,668 (676) 2,837 2,504 14,679 18,153 20,399 22,231 15,851 (17,013) 18,000
Operating margin
% 2000 2001 2002 2003 2004 2005 2006 2007 2008 2009 2010
Trucks 2.4 (1.8) 1.0 3.4 6.6 7.5 7.7 8.1 6.0 (7.8) 6.0
Construction Equipment 8.0 2.5 1.9 3.9 6.5 7.9 9.7 7.9 3.2 (11.2) 11.5
Buses 2.6 (5.5) (0.7) (6.6) 1.2 2.8 4.3 1.4 (0.4) (1.9) 3.8
Volvo Penta 7.3 8.9 8.4 9.1 10.4 9.6 10.3 10.0 8.1 (2.8) 6.6
Volvo Aero 5.8 5.5 0.1 (0.5) 5.8 11.1 4.4 6.9 4.8 0.6 3.7
Volvo Group Industrial
Operations 5.5 (0.4) 1.6 1.4 7.3 7.9 7.9 7.8 5.2 (7.8) 6.9
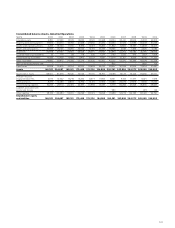
Number of employees at year-end
Number1,2 2000 2001 2002 2003 2004 2005 2006 2007 2008 2009 2010
Trucks 24,320 44,180 43,470 46,900 49,450 50,240 49,900 64,390 64,280 56,505 57,796
Buses 9,060 6,230 6,660 6,680 7,700 7,710 7,760 9,290 8,930 9,541 8,685
Construction Equipment 8,830 7,780 8,410 9,280 9,930 10,290 11,050 19,710 19,810 16,126 16,648
Volvo Penta 1,480 1,370 1,410 1,440 1,580 1,560 1,650 3,000 2,940 2,928 2,353
Volvo Aero 4,240 4,040 3,660 3,440 3,350 3,460 3,510 3,550 3,510 3,278 3,120
Financial Services 1,220 1,080 1,060 1,060 1,100 1,070 1,010 1,150 1,290 1,234 1,235
Other 5,120 6,240 6,490 6,940 7,970 7,530 8,310 610 620 596 572
Volvo Group, total 54,270 70,920 71,160 75,740 81,080 81,860 83,190 101,700 101,380 90,208 90,409
As of January 1, 2007, the benefits from the synergies created in the
business units are transferred back to the various business areas. Com-
parison figures for 2006 have been restated.
1 Operating income in 2006 includes adjustment of goodwill of neg 1,712,
reported in Trucks.
2 Operating income in 2004 included reversal of write-down of shares in Scania
AB of 915, reported in Other, and write-down of shares in Henlys Group Plc of
95, reported in Buses.
3 Operating income in 2003 included write-down of shares in Scania AB and
Henlys Group Plc amounting to 4,030, of which 429 was reported in Buses
(Henlys Group) and 3,601 was reported in Other (Scania AB).
4 Operating income in 2001 included restructuring costs mainly related to the
integration of Mack Trucks and Renault Trucks of 3,862 of which 3,106 in
Trucks, 392 in Buses and 364 in Construction Equipment.
5 Refers to Volvo Trucks for 2000.
1 As of 2007, employees in business units are allocated to the business areas.
2 As of 2009 regular employees are shown, previously temporary employees were also included.
FINANCIAL INFORMATION 2010
136