Volvo 2010 Annual Report Download - page 84
Download and view the complete annual report
Please find page 84 of the 2010 Volvo annual report below. You can navigate through the pages in the report by either clicking on the pages listed below, or by using the keyword search tool below to find specific information within the annual report.-
 1
1 -
2
-
3
-
4
-
5
-
6
-
7
-
8
-
9
-
10
-
11
-
12
-
13
-
14
-
15
-
16
-
17
-
18
-
19
-
20
-
21
-
22
-
23
-
24
-
25
-
26
-
27
-
28
-
29
-
30
-
31
-
32
-
33
-
34
-
35
-
36
-
37
-
38
-
39
-
40
-
41
-
42
-
43
-
44
-
45
-
46
-
47
-
48
-
49
-
50
-
51
-
52
-
53
-
54
-
55
-
56
-
57
-
58
-
59
-
60
-
61
-
62
-
63
-
64
-
65
-
66
-
67
-
68
-
69
-
70
-
71
-
72
-
73
-
 74
74 -
 75
75 -
 76
76 -
 77
77 -
 78
78 -
 79
79 -
 80
80 -
 81
81 -
 82
82 -
 83
83 -
 84
84 -
 85
85 -
 86
86 -
 87
87 -
 88
88 -
 89
89 -
 90
90 -
 91
91 -
 92
92 -
 93
93 -
 94
94 -
95
-
96
-
97
-
98
-
99
-
100
-
101
-
102
-
103
-
104
-
105
-
106
-
107
-
108
-
109
-
110
-
111
-
112
-
113
-
114
-
115
-
116
-
117
-
118
-
119
-
120
-
121
-
122
-
123
-
124
-
125
-
126
-
127
-
128
-
129
-
130
-
131
-
132
-
133
-
134
-
135
-
136
-
137
-
138
-
139
-
140
-
141
-
142
-
143
-
144
-
145
-
146
-
147
-
148
-
149
-
150
-
151
-
152
-
153
-
154
 |
 |
NOTES TO CONSOLIDATED FINANCIAL STATEMENTS
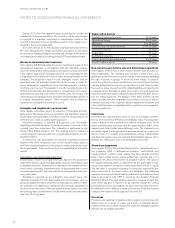
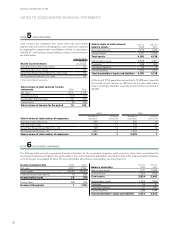
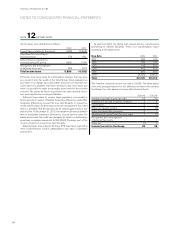
NOTE 5 JOINT VENTURES
Joint ventures are companies over which Volvo has joint control
together with one or more external parties. Joint ventures are reported
by applying the proportionate consolidation method, in accordance
with IAS 31 Joint ventures. Group holdings of shares in joint ventures
are listed below.
Dec 31, 2010
Shares in joint ventures Holding
percentage
Shanghai Sunwin Bus Corp., China 50
Xian Silver Bus Corp., China 50
Dong Feng Nissan Diesel Motor Co., Ltd., China 50
VE Commercial Vehicles, Ltd., India 501
1 Direct and indirect ownership.
Volvo’s share of joint ventures’
balance sheets Dec 31,
2009
Dec 31,
2010
Non-current assets 2,019 1,932
Current assets 2,141 2,206
Total assets 4,160 4,138
Shareholders’ equity 2,598 2,627
Provisions 286 294
Long-term liabilities 23 12
Current liabilities 1,253 1,205
Total shareholders’ equity and liabilities 4,160 4,138
At the end of 2010 guarantees amounting to 78 (80) were issued for
the benefit of joint ventures by AB Volvo. At the same date Volvo’s
share of contingent liabilities issued by its joint ventures amounted to
46 (29).
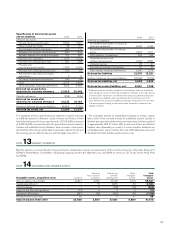
Volvo’s share of joint ventures’ income
statements 2009 2010
Net sales 3,171 4,178
Operating income (12) 127
Income after financial items 25 169
Income taxes (9) (66)
Volvo’s share of income for the period 16 103
2009 2010
Volvo’s share of total number of employees Number of
employees
of which
women, %
Number of
employees
of which
women, %
Shanghai Sunwin Bus Corp. 458 17 455 16
Xian Silver Bus Corp. 172 17 144 21
Dong Feng Nissan Diesel Motor Co., Ltd. 138 12 141 14
VE Commercial Vehicles, Ltd. 1,363 2 1,479 1
Volvo’s share of total number of employees 2,131 7 2,219 7
NOTE 6 ASSOCIATED COMPANIES
Income statement data 2009 2010
Net sales 4,027 3,794
Cost of sales (3,991) (3,840)
Financial income and expense (7) (32)
Income before taxes 29 (78)
Income taxes (28) (46)
Income of the period 1 (124)
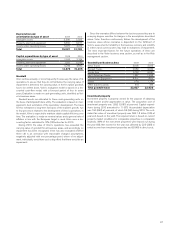
Balance sheet data Dec 31,
2009
Dec 31,
2010
Non-current assets 1,471 2,085
Current assets 1,353 1,558
Total assets 2,824 3,643
Shareholders’ equity 1,322 1,686
Provisions 59 61
Long-term liabilities 57 452
Current liabilities 1,386 1,444
Total shareholders’ equity and liabilities 2,824 3,643
The following table presents summarized financial information for the associated companies partly owned by Volvo. Volvo consolidates the
associated companies according to the equity method. The income statement and balance sheet below reflects the total associated companies,
not only the part consolidated by Volvo. For more information about Volvo’s shareholding, see notes 9 and 15.
FINANCIAL INFORMATION 2010
80