Volvo 2010 Annual Report Download - page 62
Download and view the complete annual report
Please find page 62 of the 2010 Volvo annual report below. You can navigate through the pages in the report by either clicking on the pages listed below, or by using the keyword search tool below to find specific information within the annual report.-
 1
1 -
2
-
3
-
4
-
5
-
6
-
7
-
8
-
9
-
10
-
11
-
12
-
13
-
14
-
15
-
16
-
17
-
18
-
19
-
20
-
21
-
22
-
23
-
24
-
25
-
26
-
27
-
28
-
29
-
30
-
31
-
32
-
33
-
34
-
35
-
36
-
37
-
38
-
39
-
40
-
41
-
42
-
43
-
44
-
45
-
46
-
47
-
48
-
49
-
50
-
51
-
 52
52 -
 53
53 -
 54
54 -
 55
55 -
 56
56 -
 57
57 -
 58
58 -
 59
59 -
 60
60 -
 61
61 -
 62
62 -
 63
63 -
 64
64 -
 65
65 -
 66
66 -
 67
67 -
 68
68 -
 69
69 -
 70
70 -
 71
71 -
 72
72 -
73
-
74
-
75
-
76
-
77
-
78
-
79
-
80
-
81
-
82
-
83
-
84
-
85
-
86
-
87
-
88
-
89
-
90
-
91
-
92
-
93
-
94
-
95
-
96
-
97
-
98
-
99
-
100
-
101
-
102
-
103
-
104
-
105
-
106
-
107
-
108
-
109
-
110
-
111
-
112
-
113
-
114
-
115
-
116
-
117
-
118
-
119
-
120
-
121
-
122
-
123
-
124
-
125
-
126
-
127
-
128
-
129
-
130
-
131
-
132
-
133
-
134
-
135
-
136
-
137
-
138
-
139
-
140
-
141
-
142
-
143
-
144
-
145
-
146
-
147
-
148
-
149
-
150
-
151
-
152
-
153
-
154
 |
 |

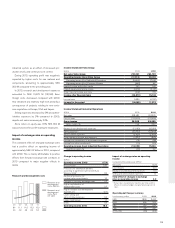
BOARD OF DIRECTORS’ REPORT 2010
Net sales by business area
SEK M 2009 2010 %
Trucks 138,940 167,305 20
Construction
Equipment 35,658 53,810 51
Buses 18,465 20,516 11
Volvo Penta 8,159 8,716 7
Volvo Aero 7,803 7,708 (1)
Eliminations and
other (538) (680) –
Industrial
Operations1208,487 257,375 23
Customer Finance 11,712 9,031 (23)
Reclassifications
and eliminations (1,838) (1,658) –
Volvo Group 218,361 264,749 21
1 Adjusted for acquired and divested units and changes in
currency rates, net sales for Industrial operations
increased by 29%.
Operating income (loss) by business area
SEK M 2009 2010
Trucks (10,805) 10,112
Construction Equipment (4,005) 6,180
Buses (350) 780
Volvo Penta (230) 578
Volvo Aero 50 286
Eliminations and other (994) (102)
Industrial Operations (16,333) 17,834
Customer Finance (680) 167
Volvo Group (17,013) 18,000
Net sales by market area
SEK M 2009 2010 %
Western Europe 84,452 87,241 3
Eastern Europe 9,632 12,570 31
North America 37,291 45,409 22
South America 16,610 27,876 68
Asia 44,842 65,072 45
Other markets 15,660 19,207 23
Total Industrial
Operations 208,487 257,375 23
The Volvo Group
Net sales
Net sales for the Volvo Group increased by
21% to SEK 264,749 M in 2010, compared
with SEK 218,361 M in 2009.
Operating income
Volvo Group operating income amounted to
SEK 18,000 M (loss: 17,013).
Operating income for the Industrial Ope-
rations increased to SEK 17,834 M compared
with an operating loss of SEK 16,333 M in
the preceding year. The Customer Finance
operations’ operating income rose to SEK
167 M (loss: 680).
Net financial items
Net interest expense was SEK 2,700 M, com-
pared with SEK 3,169 M in 2009. The improve-
ment is mainly attributable to lower expense
for post-employment benefits.
During the year, market valuation of deriva-
tives, mainly used for the customer financing
portfolio, had a positive effect on Other finan-
cial income and expenses in an amount of
SEK 871 M (neg: 90).
The currency in Venezuela was devalued
twice during 2010, which negatively impacted
Other financial income and expenses by SEK
116 M during the first quarter and an add-
itional SEK 158 M during the fourth quarter.
Income taxes
The tax expense for the year amounted to
SEK 4,302 M corresponding to a tax rate of
28%. In 2009 the tax income amounted to SEK
5,889 M and a tax rate of 29%.
Income for the period and earnings
per share
The income for the period amounted to SEK
11,212 M (loss: 14,685), corresponding to basic
and diluted earnings per share of SEK 5.36 (neg:
7.26). The return on shareholders’ equity was
16.0% (neg: 19.7).
Industrial Operations
In 2010, net sales for the Volvo Group’s Industrial
Operations increased by 23% to SEK 257,375 M
(208,487). Hard products accounted for SEK
166,945 M and soft products (services and
aftermarket products) for SEK 90,430 M of net
sales.
Compared with 2009, sales increased in all of
the Group’s market areas. Demand in Europe and
North America recovered gradually during the
year at the same time as the emerging econo-
mies in South America and Asia continued to
have strong growth. However, development in
Japan continued to be weak.
Considerable earnings improvement
In 2010, the operating income for the Volvo
Group’s Industrial Operations amounted to SEK
17,834 M, compared with an operating loss of
SEK 16,333 M in 2009. The operating margin for
the Industrial Operations amounted to 6.9%
(neg: 7.8).
The earnings improvement is the result of
increased sales, improved cost coverage in the
FINANCIAL PERFORMANCE
Operating margin
% 2009 2010
Trucks (7.8) 6.0
Construction Equipment (11.2) 11.5
Buses (1.9) 3.8
Volvo Penta (2.8) 6.6
Volvo Aero 0.6 3.7
Industrial Operations (7.8) 6.9
Volvo Group (7.8) 6.8
Strong earnings improvement
The Volvo Group made a turnaround in profitability and recorded operating
income of SEK 18 billion thanks to higher sales volumes, strict cost control,
increased capacity utilization and a good productivity trend in the industrial system.
58