US Airways 2009 Annual Report Download - page 98
Download and view the complete annual report
Please find page 98 of the 2009 US Airways annual report below. You can navigate through the pages in the report by either clicking on the pages listed below, or by using the keyword search tool below to find specific information within the annual report.-
 1
1 -
2
-
3
-
4
-
5
-
6
-
7
-
8
-
9
-
10
-
11
-
12
-
13
-
14
-
15
-
16
-
17
-
18
-
19
-
20
-
21
-
22
-
23
-
24
-
25
-
26
-
27
-
28
-
29
-
30
-
31
-
32
-
33
-
34
-
35
-
36
-
37
-
38
-
39
-
40
-
41
-
42
-
43
-
44
-
45
-
46
-
47
-
48
-
49
-
50
-
51
-
52
-
53
-
54
-
55
-
56
-
57
-
58
-
59
-
60
-
61
-
62
-
63
-
64
-
65
-
66
-
67
-
68
-
69
-
70
-
71
-
72
-
73
-
74
-
75
-
76
-
77
-
78
-
79
-
80
-
81
-
82
-
83
-
84
-
85
-
86
-
87
-
 88
88 -
 89
89 -
 90
90 -
 91
91 -
 92
92 -
 93
93 -
 94
94 -
 95
95 -
 96
96 -
 97
97 -
 98
98 -
 99
99 -
 100
100 -
 101
101 -
 102
102 -
 103
103 -
 104
104 -
 105
105 -
 106
106 -
 107
107 -
 108
108 -
109
-
110
-
111
-
112
-
113
-
114
-
115
-
116
-
117
-
118
-
119
-
120
-
121
-
122
-
123
-
124
-
125
-
126
-
127
-
128
-
129
-
130
-
131
-
132
-
133
-
134
-
135
-
136
-
137
-
138
-
139
-
140
-
141
-
142
-
143
-
144
-
145
-
146
-
147
-
148
-
149
-
150
-
151
-
152
-
153
-
154
-
155
-
156
-
157
-
158
-
159
-
160
-
161
-
162
-
163
-
164
-
165
-
166
-
167
-
168
-
169
-
170
-
171
-
172
-
173
-
174
-
175
-
176
-
177
-
178
-
179
-
180
-
181
-
182
-
183
-
184
-
185
-
186
-
187
-
188
-
189
-
190
-
191
-
192
-
193
-
194
-
195
-
196
-
197
-
198
-
199
-
200
-
201
-
202
-
203
-
204
-
205
-
206
-
207
-
208
-
209
-
210
-
211
 |
 |

Table of Contents
considering such assumptions, this accounting guidance establishes a three-tier fair value hierarchy, which prioritizes the inputs used in
measuring fair value as follows:
Level 1. Observable inputs such as quoted prices in active markets;
Level 2. Inputs, other than the quoted prices in active markets, that are observable either directly or indirectly; and
Level 3. Unobservable inputs in which there is little or no market data, which require the reporting entity to develop its own
assumptions.
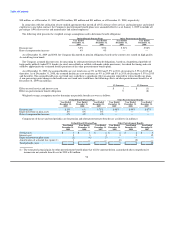
Assets measured at fair value on a recurring basis are as follows (in millions):
Quoted Prices in Significant Other Significant
Active Markets for Observable Unobservable
Identical Assets Inputs Inputs Valuation
Fair Value (Level 1) (Level 2) (Level 3) Technique
At December 31, 2009
Investments in marketable securities (noncurrent) $ 203 $ — $ — $ 203 (1)
At December 31, 2008
Investments in marketable securities (noncurrent) $ 187 $ — $ — $ 187 (1)
Fuel hedging derivatives (375) — (375) — (2)
(1) The Company estimated the fair value of its auction rate securities based on the following: (i) the underlying structure of each
security; (ii) the present value of future principal and interest payments discounted at rates considered to reflect current market
conditions; (iii) consideration of the probabilities of default, passing a future auction, or repurchase at par for each period; and
(iv) estimates of the recovery rates in the event of default for each security. These estimated fair values could change significantly
based on future market conditions. Refer to Note 6(b) for further discussion of the Company's investments in marketable securities.
(2) As the Company's fuel hedging derivative instruments were not traded on a market exchange, the fair values were determined using
valuation models which included assumptions about commodity prices based on those observed in the underlying markets. The fair
value of fuel hedging derivatives is recorded in accounts payable on the consolidated balance sheets. Refer to Note 6(a) for further
discussion of the Company's fuel hedging derivatives.
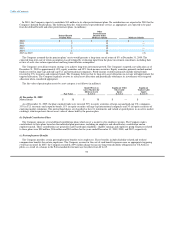
Assets measured at fair value on a recurring basis using significant unobservable inputs (Level 3) are as follows (in millions):
Investments in
Marketable
Securities
(Noncurrent)
Balance at December 31, 2007 $ 353
Losses deemed to be other than temporary reclassified from other comprehensive income to other nonoperating expense,
net 48
Impairment losses included in other nonoperating expense, net (214)
Balance at December 31, 2008 187
Net unrealized gains recorded to other comprehensive income 58
Impairment losses included in other nonoperating expense, net (10)
Sales of marketable securities (32)
Balance at December 31, 2009 $ 203
Assets measured at fair value on a nonrecurring basis are as follows (in millions):
Quoted Prices in Significant Other Significant
Active Markets for Observable Unobservable
Identical Assets Inputs Inputs Total
Fair Value (Level 1) (Level 2) (Level 3) Losses
At December 31, 2009
International route authorities $ 39 $ — $ — $ 39 $ (16)
96