US Airways 2009 Annual Report Download - page 146
Download and view the complete annual report
Please find page 146 of the 2009 US Airways annual report below. You can navigate through the pages in the report by either clicking on the pages listed below, or by using the keyword search tool below to find specific information within the annual report.-
 1
1 -
2
-
3
-
4
-
5
-
6
-
7
-
8
-
9
-
10
-
11
-
12
-
13
-
14
-
15
-
16
-
17
-
18
-
19
-
20
-
21
-
22
-
23
-
24
-
25
-
26
-
27
-
28
-
29
-
30
-
31
-
32
-
33
-
34
-
35
-
36
-
37
-
38
-
39
-
40
-
41
-
42
-
43
-
44
-
45
-
46
-
47
-
48
-
49
-
50
-
51
-
52
-
53
-
54
-
55
-
56
-
57
-
58
-
59
-
60
-
61
-
62
-
63
-
64
-
65
-
66
-
67
-
68
-
69
-
70
-
71
-
72
-
73
-
74
-
75
-
76
-
77
-
78
-
79
-
80
-
81
-
82
-
83
-
84
-
85
-
86
-
87
-
88
-
89
-
90
-
91
-
92
-
93
-
94
-
95
-
96
-
97
-
98
-
99
-
100
-
101
-
102
-
103
-
104
-
105
-
106
-
107
-
108
-
109
-
110
-
111
-
112
-
113
-
114
-
115
-
116
-
117
-
118
-
119
-
120
-
121
-
122
-
123
-
124
-
125
-
126
-
127
-
128
-
129
-
130
-
131
-
132
-
133
-
134
-
135
-
 136
136 -
 137
137 -
 138
138 -
 139
139 -
 140
140 -
 141
141 -
 142
142 -
 143
143 -
 144
144 -
 145
145 -
 146
146 -
 147
147 -
 148
148 -
 149
149 -
 150
150 -
 151
151 -
 152
152 -
 153
153 -
 154
154 -
 155
155 -
 156
156 -
157
-
158
-
159
-
160
-
161
-
162
-
163
-
164
-
165
-
166
-
167
-
168
-
169
-
170
-
171
-
172
-
173
-
174
-
175
-
176
-
177
-
178
-
179
-
180
-
181
-
182
-
183
-
184
-
185
-
186
-
187
-
188
-
189
-
190
-
191
-
192
-
193
-
194
-
195
-
196
-
197
-
198
-
199
-
200
-
201
-
202
-
203
-
204
-
205
-
206
-
207
-
208
-
209
-
210
-
211
 |
 |

Table of Contents
on the historical volatility of US Airways Group's common stock over a time period equal to the expected term of the award. The
expected life of the award is based on the historical experience of US Airways.
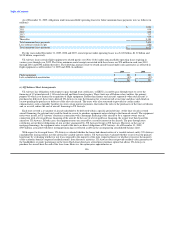
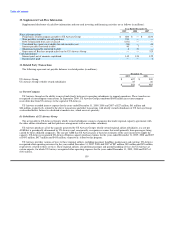
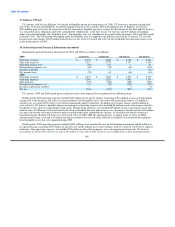
The per share weighted-average grant-date fair value of stock appreciation rights granted and the weighted-average assumptions used
for the years ended December 31, 2009, 2008 and 2007 were as follows:
Year Ended
December 31, December 31, December 31,
2009 2008 2007
Weighted average fair value $ 1.84 $ 3.28 $ 16.57
Risk free interest rate 1.3% 2.5% 4.5%
Expected dividend yield — — —
Expected life 3.0 years 3.0 years 3.0 years
Volatility 92% 62% 52%
As of December 31, 2009, there was $12 million of total unrecognized compensation costs related to stock options and SARs. These
costs are expected to be recognized over a weighted average period of 1.1 years. There were no stock options or SARs exercised during
2009. The total intrinsic value of stock options and SARs exercised during the years ended December 31, 2008 and 2007 was
$0.1 million and $4 million, respectively. Cash received from stock option and SAR exercises during the years ended December 31, 2008
and 2007 was $0.1 million and $2 million, respectively.
As of December 31, 2009, the average fair market value of outstanding CSARs was $3.52 per share and the related liability was
$3 million. These CSARs will continue to be remeasured at fair value at each reporting date until all awards are settled. As of
December 31, 2009, the total unrecognized compensation expense for CSARs was $10 million and is expected to be recognized over a
weighted average period of 1.3 years.
Agreements with the Pilot Union — US Airways Group and US Airways have a letter of agreement with the US Airways' pilot union
through April 18, 2008, that provides that US Airways' pilots designated by the union receive stock options to purchase 1.1 million shares
of US Airways Group's common stock. The first tranche of 0.5 million stock options was granted on January 31, 2006 with an exercise
price of $33.65. The second tranche of 0.3 million stock options was granted on January 31, 2007 with an exercise price of $56.90. The
third and final tranche of 0.3 million stock options was granted on January 31, 2008 with an exercise price of $12.50. The stock options
granted to pilots do not reduce the shares available for grant under any equity incentive plan. Any of these pilot stock options that are
forfeited or that expire without being exercised will not become available for grant under any of US Airways' plans.
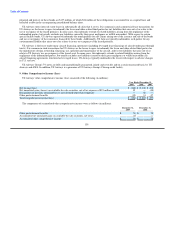
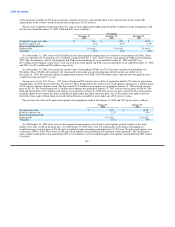
The per share fair value of the pilot stock options and assumptions used for the January 31, 2008 and 2007 grants were as follows:
January 31, January 31,
2008 2007
Per share fair value $ 3.02 $ 18.02
Risk free interest rate 2.2% 4.9%
Expected dividend yield — —
Expected life 2.0 years 2.0 years
Volatility 55% 53%
As of December 31, 2009, there were no unrecognized compensation costs related to stock options granted to pilots as the stock
options were fully vested on the grant date. As of December 31, 2009, there were 0.8 million pilot stock options outstanding at a
weighted average exercise price of $34.40 and a weighted average remaining contractual term of 7.28 years. No pilot stock options were
exercised in 2009 or 2008. There were 25,029 pilot stock options exercised during 2007 pursuant to this agreement. The total intrinsic
value of pilot stock options exercised during 2007 was $1 million. Cash received from pilot stock options exercised during 2007 totaled
$1 million.
144