US Airways 2009 Annual Report Download - page 56
Download and view the complete annual report
Please find page 56 of the 2009 US Airways annual report below. You can navigate through the pages in the report by either clicking on the pages listed below, or by using the keyword search tool below to find specific information within the annual report.-
 1
1 -
2
-
3
-
4
-
5
-
6
-
7
-
8
-
9
-
10
-
11
-
12
-
13
-
14
-
15
-
16
-
17
-
18
-
19
-
20
-
21
-
22
-
23
-
24
-
25
-
26
-
27
-
28
-
29
-
30
-
31
-
32
-
33
-
34
-
35
-
36
-
37
-
38
-
39
-
40
-
41
-
42
-
43
-
44
-
45
-
 46
46 -
 47
47 -
 48
48 -
 49
49 -
 50
50 -
 51
51 -
 52
52 -
 53
53 -
 54
54 -
 55
55 -
 56
56 -
 57
57 -
 58
58 -
 59
59 -
 60
60 -
 61
61 -
 62
62 -
 63
63 -
 64
64 -
 65
65 -
 66
66 -
67
-
68
-
69
-
70
-
71
-
72
-
73
-
74
-
75
-
76
-
77
-
78
-
79
-
80
-
81
-
82
-
83
-
84
-
85
-
86
-
87
-
88
-
89
-
90
-
91
-
92
-
93
-
94
-
95
-
96
-
97
-
98
-
99
-
100
-
101
-
102
-
103
-
104
-
105
-
106
-
107
-
108
-
109
-
110
-
111
-
112
-
113
-
114
-
115
-
116
-
117
-
118
-
119
-
120
-
121
-
122
-
123
-
124
-
125
-
126
-
127
-
128
-
129
-
130
-
131
-
132
-
133
-
134
-
135
-
136
-
137
-
138
-
139
-
140
-
141
-
142
-
143
-
144
-
145
-
146
-
147
-
148
-
149
-
150
-
151
-
152
-
153
-
154
-
155
-
156
-
157
-
158
-
159
-
160
-
161
-
162
-
163
-
164
-
165
-
166
-
167
-
168
-
169
-
170
-
171
-
172
-
173
-
174
-
175
-
176
-
177
-
178
-
179
-
180
-
181
-
182
-
183
-
184
-
185
-
186
-
187
-
188
-
189
-
190
-
191
-
192
-
193
-
194
-
195
-
196
-
197
-
198
-
199
-
200
-
201
-
202
-
203
-
204
-
205
-
206
-
207
-
208
-
209
-
210
-
211
 |
 |

Table of Contents
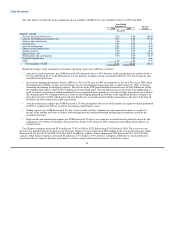
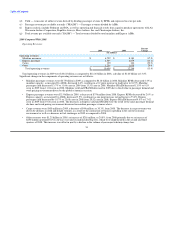
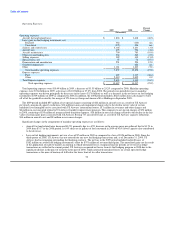
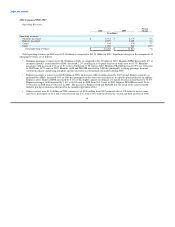
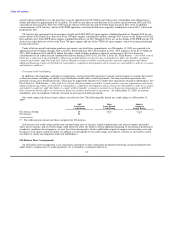
2008 Compared With 2007
Operating Revenues:
Percent
2008 2007 Change
(In millions)
Operating revenues:
Mainline passenger $ 8,183 $ 8,135 0.6
Express passenger 2,879 2,698 6.7
Cargo 144 138 3.7
Other 1,038 842 23.3
Total operating revenues $ 12,244 $ 11,813 3.6
Total operating revenues in 2008 were $12.24 billion as compared to $11.81 billion in 2007. Significant changes in the components of
operating revenues are as follows:
• Mainline passenger revenues were $8.18 billion in 2008, as compared to $8.14 billion in 2007. Mainline RPMs decreased 1.1% as
mainline capacity, as measured by ASMs, decreased 2.2%, resulting in a 0.9 point increase in load factor to 81.7%. Mainline
passenger yield increased 1.7% to 13.51 cents in 2008 from 13.28 cents in 2007. Mainline PRASM increased 2.9% to 11.04 cents
in 2008 from 10.73 cents in 2007. Mainline yield and PRASM increased in 2008 due principally to strong passenger demand,
continued capacity and pricing discipline and fare increases in substantially all markets during 2008.
• Express passenger revenues were $2.88 billion in 2008, an increase of $181 million from the 2007 period. Express capacity, as
measured by ASMs, increased 5.6% in 2008 due principally to the year-over-year increase in capacity purchased from an affiliate
Express carrier. Express RPMs increased by 5.1% on this higher capacity resulting in a 0.4 point decrease in load factor to 72.6%.
Express passenger yield increased by 1.6% to 26.52 cents in 2008 from 26.12 cents in 2007. Express PRASM increased 1% to
19.26 cents in 2008 from 19.06 cents in 2007. The increase in Express yield and PRASM was the result of the same favorable
industry pricing environment discussed in the mainline operations above.
• Other revenues were $1.04 billion in 2008, an increase of $196 million from 2007 primarily due to US Airways' new revenue
initiatives, principally its first and second checked bag fees, which were implemented in the second and third quarters of 2008.
54