US Airways 2009 Annual Report Download - page 169
Download and view the complete annual report
Please find page 169 of the 2009 US Airways annual report below. You can navigate through the pages in the report by either clicking on the pages listed below, or by using the keyword search tool below to find specific information within the annual report.-
 1
1 -
2
-
3
-
4
-
5
-
6
-
7
-
8
-
9
-
10
-
11
-
12
-
13
-
14
-
15
-
16
-
17
-
18
-
19
-
20
-
21
-
22
-
23
-
24
-
25
-
26
-
27
-
28
-
29
-
30
-
31
-
32
-
33
-
34
-
35
-
36
-
37
-
38
-
39
-
40
-
41
-
42
-
43
-
44
-
45
-
46
-
47
-
48
-
49
-
50
-
51
-
52
-
53
-
54
-
55
-
56
-
57
-
58
-
59
-
60
-
61
-
62
-
63
-
64
-
65
-
66
-
67
-
68
-
69
-
70
-
71
-
72
-
73
-
74
-
75
-
76
-
77
-
78
-
79
-
80
-
81
-
82
-
83
-
84
-
85
-
86
-
87
-
88
-
89
-
90
-
91
-
92
-
93
-
94
-
95
-
96
-
97
-
98
-
99
-
100
-
101
-
102
-
103
-
104
-
105
-
106
-
107
-
108
-
109
-
110
-
111
-
112
-
113
-
114
-
115
-
116
-
117
-
118
-
119
-
120
-
121
-
122
-
123
-
124
-
125
-
126
-
127
-
128
-
129
-
130
-
131
-
132
-
133
-
134
-
135
-
136
-
137
-
138
-
139
-
140
-
141
-
142
-
143
-
144
-
145
-
146
-
147
-
148
-
149
-
150
-
151
-
152
-
153
-
154
-
155
-
156
-
157
-
158
-
 159
159 -
 160
160 -
 161
161 -
 162
162 -
 163
163 -
 164
164 -
 165
165 -
 166
166 -
 167
167 -
 168
168 -
 169
169 -
 170
170 -
 171
171 -
 172
172 -
 173
173 -
 174
174 -
 175
175 -
 176
176 -
 177
177 -
 178
178 -
 179
179 -
180
-
181
-
182
-
183
-
184
-
185
-
186
-
187
-
188
-
189
-
190
-
191
-
192
-
193
-
194
-
195
-
196
-
197
-
198
-
199
-
200
-
201
-
202
-
203
-
204
-
205
-
206
-
207
-
208
-
209
-
210
-
211
 |
 |

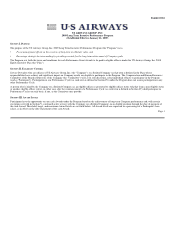
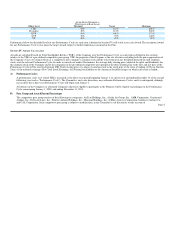
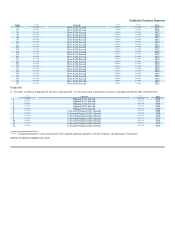
AWARD LEVELS EXPRESSED AS
PERCENTAGES OF BASE SALARY
Officer Level Threshold Target Maximum
CEO 54% 125% 200%
President 49% 115% 200%
EVP 43% 100% 175%
SVP 30% 70% 140%
VP 20% 45% 90%
Performance below the threshold level for any Performance Cycle (as such term is defined in Section IV) will result in no cash Award. The maximum Award
for any Performance Cycle is two times the target Award, subject to further limitations contained in the Plan.
SECTION IV. AWARD CALCULATION
Awards are calculated based on Total Stockholder Return ("TSR") of the Company over the Performance Cycle (as such term is defined in this section)
relative to the TSRs of a pre-defined competitive peer group. TSR, for purposes of this Program, is the rate of return, including both the price appreciation of
the Company's Class A Common Stock or a competitive peer company's common stock and the reinvestment of any dividends declared on such common
stock, over the relevant Performance Cycle. In order to smooth out market fluctuations, the average daily closing price (adjusted for splits and dividends) for
the common stock of the Company and of the companies in the pre-defined competitive peer group for the three months prior to the first and last days of the
Performance Cycle will be used to determine TSR. Daily closing price of a share of common stock is the stock price at the close of trading (4:00 p.m. Eastern
Time) of the national exchange (New York Stock Exchange, the Nasdaq Stock Market or the American Stock Exchange) on which such stock is traded.
A) Performance Cycles
A performance cycle, over which TSR is measured, is the three-year period beginning January 1 of a given year and ending December 31 of the second
following year (each a "Performance Cycle"). The Committee, in its sole discretion, may authorize Performance Cycles, and it is anticipated, although
not assured, that a three-year Performance Cycle will begin each January 1.
All officers of the Company (or a Related Company) otherwise eligible to participate in the Program will be eligible to participate in the Performance
Cycle commencing January 1, 2009, and ending December 31, 2011.
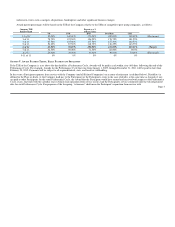
B) Peer Group and Award Payout Percentages
The competitive peer group consists of the following ten companies: AirTran Holdings, Inc., Alaska Air Group, Inc., AMR Corporation, Continental
Airlines, Inc., Delta Air Lines, Inc., Frontier Airlines Holdings, Inc., Hawaiian Holdings, Inc., JetBlue Airways Corporation, Southwest Airlines Co.
and UAL Corporation. Such competitive peer group is subject to modification, in the Committee's sole discretion, to take account of Page 2