US Airways 2009 Annual Report Download - page 53
Download and view the complete annual report
Please find page 53 of the 2009 US Airways annual report below. You can navigate through the pages in the report by either clicking on the pages listed below, or by using the keyword search tool below to find specific information within the annual report.-
 1
1 -
2
-
3
-
4
-
5
-
6
-
7
-
8
-
9
-
10
-
11
-
12
-
13
-
14
-
15
-
16
-
17
-
18
-
19
-
20
-
21
-
22
-
23
-
24
-
25
-
26
-
27
-
28
-
29
-
30
-
31
-
32
-
33
-
34
-
35
-
36
-
37
-
38
-
39
-
40
-
41
-
42
-
 43
43 -
 44
44 -
 45
45 -
 46
46 -
 47
47 -
 48
48 -
 49
49 -
 50
50 -
 51
51 -
 52
52 -
 53
53 -
 54
54 -
 55
55 -
 56
56 -
 57
57 -
 58
58 -
 59
59 -
 60
60 -
 61
61 -
 62
62 -
 63
63 -
64
-
65
-
66
-
67
-
68
-
69
-
70
-
71
-
72
-
73
-
74
-
75
-
76
-
77
-
78
-
79
-
80
-
81
-
82
-
83
-
84
-
85
-
86
-
87
-
88
-
89
-
90
-
91
-
92
-
93
-
94
-
95
-
96
-
97
-
98
-
99
-
100
-
101
-
102
-
103
-
104
-
105
-
106
-
107
-
108
-
109
-
110
-
111
-
112
-
113
-
114
-
115
-
116
-
117
-
118
-
119
-
120
-
121
-
122
-
123
-
124
-
125
-
126
-
127
-
128
-
129
-
130
-
131
-
132
-
133
-
134
-
135
-
136
-
137
-
138
-
139
-
140
-
141
-
142
-
143
-
144
-
145
-
146
-
147
-
148
-
149
-
150
-
151
-
152
-
153
-
154
-
155
-
156
-
157
-
158
-
159
-
160
-
161
-
162
-
163
-
164
-
165
-
166
-
167
-
168
-
169
-
170
-
171
-
172
-
173
-
174
-
175
-
176
-
177
-
178
-
179
-
180
-
181
-
182
-
183
-
184
-
185
-
186
-
187
-
188
-
189
-
190
-
191
-
192
-
193
-
194
-
195
-
196
-
197
-
198
-
199
-
200
-
201
-
202
-
203
-
204
-
205
-
206
-
207
-
208
-
209
-
210
-
211
 |
 |

Table of Contents
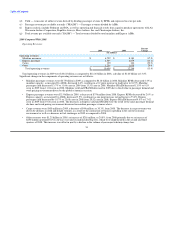
(d) Yield — A measure of airline revenue derived by dividing passenger revenue by RPMs and expressed in cents per mile.
(e) Passenger revenue per available seat mile ("PRASM") — Passenger revenues divided by ASMs.
(f) Express statistics include Piedmont and PSA, as well as operating and financial results from capacity purchase agreements with Air
Wisconsin Airlines Corporation, Republic Airways, Mesa Airlines, Inc. and Chautauqua Airlines, Inc.
(g) Total revenue per available seat mile ("RASM") — Total revenues divided by total mainline and Express ASMs.
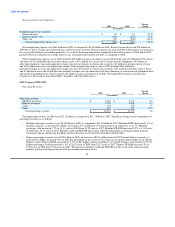
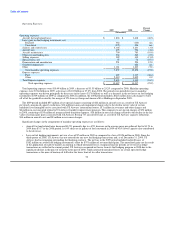
2009 Compared With 2008
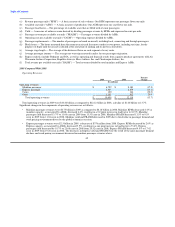
Operating Revenues:
Percent
2009 2008 Change
(In millions)
Operating revenues:
Mainline passenger $ 6,752 $ 8,183 (17.5)
Express passenger 2,503 2,879 (13.1)
Cargo 100 144 (30.3)
Other 1,254 1,038 20.8
Total operating revenues $ 10,609 $ 12,244 (13.4)
Total operating revenues in 2009 were $10.61 billion as compared to $12.24 billion in 2008, a decline of $1.64 billion or 13.4%.
Significant changes in the components of operating revenues are as follows:
• Mainline passenger revenues were $6.75 billion in 2009 as compared to $8.18 billion in 2008. Mainline RPMs decreased 4.4% as
mainline capacity, as measured by ASMs, decreased 4.6%, resulting in a 0.2 point increase in load factor to 81.9%. Mainline
passenger yield decreased 13.7% to 11.66 cents in 2009 from 13.51 cents in 2008. Mainline PRASM decreased 13.5% to 9.55
cents in 2009 from 11.04 cents in 2008. Mainline yield and PRASM decreased in 2009 due to the decline in passenger demand and
weak pricing environment driven by the global economic recession.
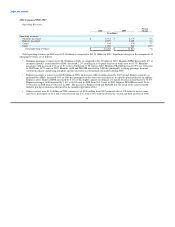
• Express passenger revenues were $2.5 billion in 2009, a decrease of $376 million from 2008. Express RPMs decreased by 2.6% as
Express capacity, as measured by ASMs, decreased 3.9%, resulting in a one point increase in load factor to 73.6%. Express
passenger yield decreased by 10.7% to 23.68 cents in 2009 from 26.52 cents in 2008. Express PRASM decreased 9.5% to 17.42
cents in 2009 from 19.26 cents in 2008. The decreases in Express yield and PRASM were the result of the same passenger demand
declines and weak pricing environment discussed in mainline passenger revenues above.
• Cargo revenues were $100 million in 2009, a decrease of $44 million, or 30.3%, from 2008. The decrease in cargo revenues was
driven by declines in yield and freight volumes as a result of the contraction of business spending in the current economic
environment as well as a decrease in fuel surcharges in 2009 as compared to 2008.
• Other revenues were $1.25 billion in 2009, an increase of $216 million, or 20.8%, from 2008 primarily due to an increase of
$250 million generated by US Airways' first and second checked bag fees, which were implemented in the second and third
quarters of 2008. This increase was offset in part by a decline in the volume of passenger ticketing change fees.
51