US Airways 2009 Annual Report Download - page 72
Download and view the complete annual report
Please find page 72 of the 2009 US Airways annual report below. You can navigate through the pages in the report by either clicking on the pages listed below, or by using the keyword search tool below to find specific information within the annual report.-
 1
1 -
2
-
3
-
4
-
5
-
6
-
7
-
8
-
9
-
10
-
11
-
12
-
13
-
14
-
15
-
16
-
17
-
18
-
19
-
20
-
21
-
22
-
23
-
24
-
25
-
26
-
27
-
28
-
29
-
30
-
31
-
32
-
33
-
34
-
35
-
36
-
37
-
38
-
39
-
40
-
41
-
42
-
43
-
44
-
45
-
46
-
47
-
48
-
49
-
50
-
51
-
52
-
53
-
54
-
55
-
56
-
57
-
58
-
59
-
60
-
61
-
 62
62 -
 63
63 -
 64
64 -
 65
65 -
 66
66 -
 67
67 -
 68
68 -
 69
69 -
 70
70 -
 71
71 -
 72
72 -
 73
73 -
 74
74 -
 75
75 -
 76
76 -
 77
77 -
 78
78 -
 79
79 -
 80
80 -
 81
81 -
 82
82 -
83
-
84
-
85
-
86
-
87
-
88
-
89
-
90
-
91
-
92
-
93
-
94
-
95
-
96
-
97
-
98
-
99
-
100
-
101
-
102
-
103
-
104
-
105
-
106
-
107
-
108
-
109
-
110
-
111
-
112
-
113
-
114
-
115
-
116
-
117
-
118
-
119
-
120
-
121
-
122
-
123
-
124
-
125
-
126
-
127
-
128
-
129
-
130
-
131
-
132
-
133
-
134
-
135
-
136
-
137
-
138
-
139
-
140
-
141
-
142
-
143
-
144
-
145
-
146
-
147
-
148
-
149
-
150
-
151
-
152
-
153
-
154
-
155
-
156
-
157
-
158
-
159
-
160
-
161
-
162
-
163
-
164
-
165
-
166
-
167
-
168
-
169
-
170
-
171
-
172
-
173
-
174
-
175
-
176
-
177
-
178
-
179
-
180
-
181
-
182
-
183
-
184
-
185
-
186
-
187
-
188
-
189
-
190
-
191
-
192
-
193
-
194
-
195
-
196
-
197
-
198
-
199
-
200
-
201
-
202
-
203
-
204
-
205
-
206
-
207
-
208
-
209
-
210
-
211
 |
 |

Table of Contents
(a) vendor-specific objective evidence; (b) third-party evidence; or (c) estimates. This guidance also eliminates the residual method of
allocation and requires that arrangement consideration be allocated at the inception of the arrangement to all deliverables using the
relative selling price method. In addition, this guidance significantly expands required disclosures related to a vendor's multiple-
deliverable revenue arrangements. ASU No. 2009-13 is effective prospectively for revenue arrangements entered into or materially
modified in fiscal years beginning on or after June 15, 2010 and early adoption is permitted. A company may elect, but will not be
required, to adopt the amendments in ASU No. 2009-13 retrospectively for all prior periods. We are currently evaluating the requirements
of ASU No. 2009-13 and have not yet determined the impact on our consolidated financial statements.
Item 7A. Quantitative and Qualitative Disclosures About Market Risk
Market Risk Sensitive Instruments
Our primary market risk exposures include commodity price risk (i.e., the price paid to obtain aviation fuel) and interest rate risk. The
potential impact of adverse increases in these risks is discussed below. The following sensitivity analyses do not consider the effects that
an adverse change may have on the overall economy nor do they consider additional actions we may take to mitigate our exposure to
these changes. Actual results of changes in prices or rates may differ materially from the following hypothetical results.
Commodity Price Risk
Prices and availability of all petroleum products are subject to political, economic and market factors that are generally outside of our
control. Accordingly, the price and availability of aviation fuel, as well as other petroleum products, can be unpredictable. Prices and
availability may be affected by many factors, including:
• the impact of global political instability on crude production;
• unexpected changes to the availability of petroleum products due to disruptions in distribution systems or refineries as evidenced
in the third quarter of 2005 when Hurricane Katrina and Hurricane Rita caused widespread disruption to oil production, refinery
operations and pipeline capacity along certain portions of the U.S. Gulf Coast;
• unpredicted increases to oil demand due to weather or the pace of economic growth;
• inventory levels of crude, refined products and natural gas; and
• other factors, such as the relative fluctuation in value between the U.S. dollar and other major currencies and influence of
speculative positions on the futures exchanges.
Our 2010 forecasted mainline and Express fuel consumption is approximately 1.42 billion gallons, and a one cent per gallon increase
in aviation fuel price results in a $14 million annual increase in expense. Since the third quarter of 2008, we have not entered into any
new fuel hedging transactions and, as of December 31, 2009, we had no remaining outstanding fuel hedging contracts.
Interest Rate Risk
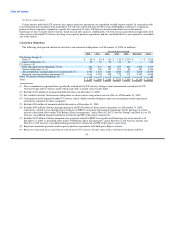
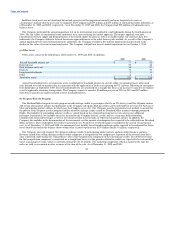
Our exposure to interest rate risk relates primarily to our cash equivalents, investment portfolios and variable rate debt obligations. At
December 31, 2009, our variable-rate long-term debt obligations of approximately $3.33 billion represented approximately 69% of our
total long-term debt. If interest rates increased 10% in 2009, the impact on our results of operations would have been approximately
$13 million of additional interest expense. Additional information regarding our debt obligations as of December 31, 2009 is as follows
(dollars in millions):
Expected Maturity Date
2010 2011 2012 2013 2014 Thereafter Total
Fixed-rate debt $ 240 $ 159 $ 138 $ 76 $ 252 $ 601 $ 1,466
Weighted avg. interest rate 9.4% 9.0% 8.4% 8.2% 8.4% 7.5%
Variable-rate debt $ 271 $ 191 $ 283 $ 295 $ 1,289 $ 998 $ 3,327
Weighted avg. interest rate 3.9% 3.8% 3.7% 3.5% 3.5% 3.7%
70