US Airways 2009 Annual Report Download - page 54
Download and view the complete annual report
Please find page 54 of the 2009 US Airways annual report below. You can navigate through the pages in the report by either clicking on the pages listed below, or by using the keyword search tool below to find specific information within the annual report.-
 1
1 -
2
-
3
-
4
-
5
-
6
-
7
-
8
-
9
-
10
-
11
-
12
-
13
-
14
-
15
-
16
-
17
-
18
-
19
-
20
-
21
-
22
-
23
-
24
-
25
-
26
-
27
-
28
-
29
-
30
-
31
-
32
-
33
-
34
-
35
-
36
-
37
-
38
-
39
-
40
-
41
-
42
-
43
-
 44
44 -
 45
45 -
 46
46 -
 47
47 -
 48
48 -
 49
49 -
 50
50 -
 51
51 -
 52
52 -
 53
53 -
 54
54 -
 55
55 -
 56
56 -
 57
57 -
 58
58 -
 59
59 -
 60
60 -
 61
61 -
 62
62 -
 63
63 -
 64
64 -
65
-
66
-
67
-
68
-
69
-
70
-
71
-
72
-
73
-
74
-
75
-
76
-
77
-
78
-
79
-
80
-
81
-
82
-
83
-
84
-
85
-
86
-
87
-
88
-
89
-
90
-
91
-
92
-
93
-
94
-
95
-
96
-
97
-
98
-
99
-
100
-
101
-
102
-
103
-
104
-
105
-
106
-
107
-
108
-
109
-
110
-
111
-
112
-
113
-
114
-
115
-
116
-
117
-
118
-
119
-
120
-
121
-
122
-
123
-
124
-
125
-
126
-
127
-
128
-
129
-
130
-
131
-
132
-
133
-
134
-
135
-
136
-
137
-
138
-
139
-
140
-
141
-
142
-
143
-
144
-
145
-
146
-
147
-
148
-
149
-
150
-
151
-
152
-
153
-
154
-
155
-
156
-
157
-
158
-
159
-
160
-
161
-
162
-
163
-
164
-
165
-
166
-
167
-
168
-
169
-
170
-
171
-
172
-
173
-
174
-
175
-
176
-
177
-
178
-
179
-
180
-
181
-
182
-
183
-
184
-
185
-
186
-
187
-
188
-
189
-
190
-
191
-
192
-
193
-
194
-
195
-
196
-
197
-
198
-
199
-
200
-
201
-
202
-
203
-
204
-
205
-
206
-
207
-
208
-
209
-
210
-
211
 |
 |

Table of Contents
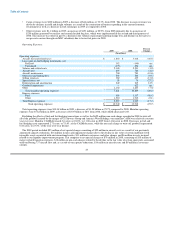
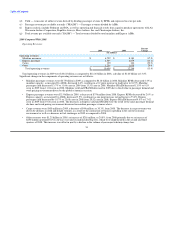
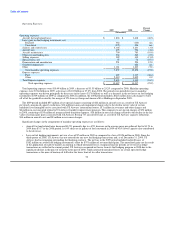
Operating Expenses:
Percent
2009 2008 Change
(In millions)
Operating expenses:
Aircraft fuel and related taxes $ 1,863 $ 3,618 (48.5)
Loss (gain) on fuel hedging instruments, net:
Realized 382 (140) nm
Unrealized (375) 496 nm
Salaries and related costs 2,165 2,231 (3.0)
Aircraft rent 695 724 (4.0)
Aircraft maintenance 700 783 (10.6)
Other rent and landing fees 560 562 (0.5)
Selling expenses 382 439 (13.0)
Special items, net 55 76 (27.3)
Depreciation and amortization 251 224 12.0
Goodwill impairment — 622 nm
Other 1,181 1,243 (5.1)
Total mainline operating expenses 7,859 10,878 (27.8)
Express expenses:
Fuel 609 1,137 (46.4)
Other 2,019 2,002 0.9
Total Express expenses 2,628 3,139 (16.3)
Total operating expenses $ 10,487 $ 14,017 (25.2)
Total operating expenses were $10.49 billion in 2009, a decrease of $3.53 billion or 25.2% compared to 2008. Mainline operating
expenses were $7.86 billion in 2009, a decrease of $3.02 billion or 27.8% from 2008. The period-over-period decrease in mainline
operating expenses was driven principally by decreases in fuel costs ($1.76 billion) as well as a decrease in the net losses on fuel hedging
instruments ($349 million) in 2009 as compared to 2008. In addition, the 2008 period included a $622 million non-cash charge to write
off all of the goodwill created by the merger of US Airways Group and America West Holdings in September 2005.
The 2009 period included $55 million of net special charges consisting of $22 million in aircraft costs as a result of US Airways'
previously announced capacity reductions, $16 million in non-cash impairment charges due to the decline in fair value of certain
indefinite lived intangible assets associated with US Airways' international routes, $11 million in severance and other charges and
$6 million in costs incurred related to US Airways' liquidity improvement program. This compares to net special charges of $76 million
in 2008, consisting of $35 million of merger-related transition expenses, $18 million in non-cash charges related to the decline in the fair
value of certain spare parts associated with US Airways' Boeing 737 aircraft fleet and, as a result of US Airways' capacity reductions,
$14 million in aircraft costs and $9 million in severance charges.
Significant changes in the components of mainline operating expense are as follows:
• Aircraft fuel and related taxes decreased 48.5% primarily due to a 45% decrease in the average price per gallon of fuel to $1.74 in
2009 from $3.17 in the 2008 period. A 6.4% decrease in gallons of fuel consumed in 2009 on 4.6% lower capacity also contributed
to the decrease.
• Loss on fuel hedging instruments, net was a loss of $7 million in 2009 as compared to a loss of $356 million in 2008. Since the
third quarter of 2008, US Airways has not entered into any new fuel hedging transactions and, as of December 31, 2009, US
Airways had no remaining outstanding fuel hedging contracts. The net loss in the 2009 period included realized losses of
$382 million on settled fuel hedging instruments, offset by $375 million of net unrealized gains. The unrealized gains are the result
of the application of mark-to-market accounting in which unrealized losses recognized in prior periods are reversed as hedge
transactions are settled in the current period. US Airways recognized net losses from its fuel hedging program in 2008 due to the
significant decline in the price of oil in the latter part of 2008, which generated unrealized losses on certain open fuel hedge
transactions as the price of heating oil fell below the lower limit of its collar transactions.
52