US Airways 2009 Annual Report Download - page 58
Download and view the complete annual report
Please find page 58 of the 2009 US Airways annual report below. You can navigate through the pages in the report by either clicking on the pages listed below, or by using the keyword search tool below to find specific information within the annual report.-
 1
1 -
2
-
3
-
4
-
5
-
6
-
7
-
8
-
9
-
10
-
11
-
12
-
13
-
14
-
15
-
16
-
17
-
18
-
19
-
20
-
21
-
22
-
23
-
24
-
25
-
26
-
27
-
28
-
29
-
30
-
31
-
32
-
33
-
34
-
35
-
36
-
37
-
38
-
39
-
40
-
41
-
42
-
43
-
44
-
45
-
46
-
47
-
 48
48 -
 49
49 -
 50
50 -
 51
51 -
 52
52 -
 53
53 -
 54
54 -
 55
55 -
 56
56 -
 57
57 -
 58
58 -
 59
59 -
 60
60 -
 61
61 -
 62
62 -
 63
63 -
 64
64 -
 65
65 -
 66
66 -
 67
67 -
 68
68 -
69
-
70
-
71
-
72
-
73
-
74
-
75
-
76
-
77
-
78
-
79
-
80
-
81
-
82
-
83
-
84
-
85
-
86
-
87
-
88
-
89
-
90
-
91
-
92
-
93
-
94
-
95
-
96
-
97
-
98
-
99
-
100
-
101
-
102
-
103
-
104
-
105
-
106
-
107
-
108
-
109
-
110
-
111
-
112
-
113
-
114
-
115
-
116
-
117
-
118
-
119
-
120
-
121
-
122
-
123
-
124
-
125
-
126
-
127
-
128
-
129
-
130
-
131
-
132
-
133
-
134
-
135
-
136
-
137
-
138
-
139
-
140
-
141
-
142
-
143
-
144
-
145
-
146
-
147
-
148
-
149
-
150
-
151
-
152
-
153
-
154
-
155
-
156
-
157
-
158
-
159
-
160
-
161
-
162
-
163
-
164
-
165
-
166
-
167
-
168
-
169
-
170
-
171
-
172
-
173
-
174
-
175
-
176
-
177
-
178
-
179
-
180
-
181
-
182
-
183
-
184
-
185
-
186
-
187
-
188
-
189
-
190
-
191
-
192
-
193
-
194
-
195
-
196
-
197
-
198
-
199
-
200
-
201
-
202
-
203
-
204
-
205
-
206
-
207
-
208
-
209
-
210
-
211
 |
 |
Table of Contents
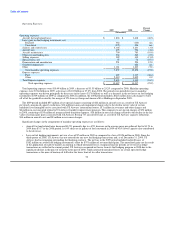
• Other rent and landing fees increased 4.9% due primarily to increases in rental rates at certain airports in 2008 as compared to
2007.
• Depreciation and amortization increased 13.1% due to the acquisition of 14 Embraer aircraft and five Airbus aircraft in 2008,
which increased depreciation expense on owned aircraft.
Total Express expenses increased 15.1% in 2008 to $3.14 billion from $2.73 billion in 2007. Express fuel costs increased $372 million
as the average fuel price per gallon increased 44.8% from $2.23 in 2007 to a record high $3.23 in 2008. Other Express operating expenses
increased $40 million year over year as a result of the 5.6% increase in Express capacity in 2008, partially offset by a decrease in amounts
paid under capacity purchases with US Airways Group's wholly owned Express carriers.
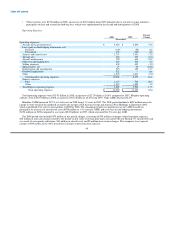
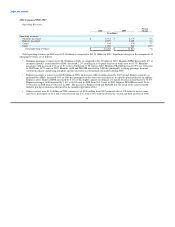
Nonoperating Income (Expense):
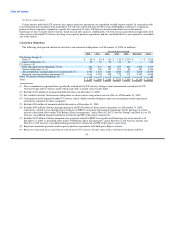
Percent
2008 2007 Change
(In millions)
Nonoperating income (expense):
Interest income $ 83 $ 172 (51.6)
Interest expense, net (218) (229) (5.1)
Other, net (240) 18 nm
Total nonoperating expense, net $ (375) $ (39) nm
Net nonoperating expense was $375 million in 2008 as compared to $39 million in 2007. Interest income decreased $89 million in
2008 due to lower average investment balances and lower rates of return. Interest expense, net decreased $11 million due primarily to
reductions in average interest rates associated with variable rate debt, partially offset by an increase in the average debt balance
outstanding as compared to the 2007 period.
Other nonoperating expense, net in 2008 included $214 million in other-than-temporary non-cash impairment charges for US Airways'
investments in auction rate securities primarily due to the length of time and extent to which the fair value has been less than cost for
these securities. US Airways also recognized $25 million in foreign currency losses and $6 million in write offs of debt discount and debt
issuance costs in connection with the refinancing of certain aircraft equipment notes and a loan prepayment in connection with US
Airways' 2008 financing transactions, offset in part by $8 million in gains on forgiveness of debt. Other nonoperating expense, net in
2007 included a $17 million gain on the sale of stock in ARINC Incorporated as well as $7 million in foreign currency gains, offset by
$10 million in other-than-temporary non-cash impairment charges for US Airways' investments in auction rate securities.
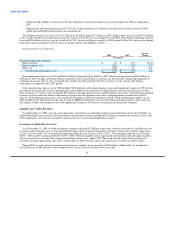
Liquidity and Capital Resources
As of December 31, 2009, our cash, cash equivalents, investments in marketable securities and restricted cash were $1.98 billion, of
which $480 million was restricted. Our investments in marketable securities included $203 million of auction rate securities at fair value
($347 million par value) that are classified as noncurrent assets on our consolidated balance sheets.
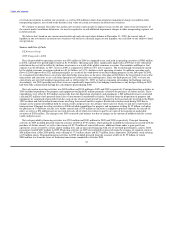
Investments in Marketable Securities
As of December 31, 2009, we held auction rate securities totaling $347 million at par value, which are classified as available-for-sale
securities and noncurrent assets on our consolidated balance sheets. Contractual maturities for these auction rate securities range from
seven to 43 years, with 73% of our portfolio maturing within the next 10 years (2016 – 2017), 19% maturing within the next 30 years
(2033 – 2036) and 8% maturing thereafter (2049 – 2052). With the liquidity issues experienced in the global credit and capital markets,
all of our auction rate securities have experienced failed auctions since August 2007. The estimated fair value of these auction rate
securities no longer approximates par value. At December 31 2009, the fair value of our auction rate securities was $203 million.
During 2009, we sold certain investments in auction rate securities for net proceeds of $32 million. Additionally, we recorded net
unrealized gains of $58 million in other comprehensive income related to the increase in fair value
56