US Airways 2009 Annual Report Download - page 134
Download and view the complete annual report
Please find page 134 of the 2009 US Airways annual report below. You can navigate through the pages in the report by either clicking on the pages listed below, or by using the keyword search tool below to find specific information within the annual report.-
 1
1 -
2
-
3
-
4
-
5
-
6
-
7
-
8
-
9
-
10
-
11
-
12
-
13
-
14
-
15
-
16
-
17
-
18
-
19
-
20
-
21
-
22
-
23
-
24
-
25
-
26
-
27
-
28
-
29
-
30
-
31
-
32
-
33
-
34
-
35
-
36
-
37
-
38
-
39
-
40
-
41
-
42
-
43
-
44
-
45
-
46
-
47
-
48
-
49
-
50
-
51
-
52
-
53
-
54
-
55
-
56
-
57
-
58
-
59
-
60
-
61
-
62
-
63
-
64
-
65
-
66
-
67
-
68
-
69
-
70
-
71
-
72
-
73
-
74
-
75
-
76
-
77
-
78
-
79
-
80
-
81
-
82
-
83
-
84
-
85
-
86
-
87
-
88
-
89
-
90
-
91
-
92
-
93
-
94
-
95
-
96
-
97
-
98
-
99
-
100
-
101
-
102
-
103
-
104
-
105
-
106
-
107
-
108
-
109
-
110
-
111
-
112
-
113
-
114
-
115
-
116
-
117
-
118
-
119
-
120
-
121
-
122
-
123
-
 124
124 -
 125
125 -
 126
126 -
 127
127 -
 128
128 -
 129
129 -
 130
130 -
 131
131 -
 132
132 -
 133
133 -
 134
134 -
 135
135 -
 136
136 -
 137
137 -
 138
138 -
 139
139 -
 140
140 -
 141
141 -
 142
142 -
 143
143 -
 144
144 -
145
-
146
-
147
-
148
-
149
-
150
-
151
-
152
-
153
-
154
-
155
-
156
-
157
-
158
-
159
-
160
-
161
-
162
-
163
-
164
-
165
-
166
-
167
-
168
-
169
-
170
-
171
-
172
-
173
-
174
-
175
-
176
-
177
-
178
-
179
-
180
-
181
-
182
-
183
-
184
-
185
-
186
-
187
-
188
-
189
-
190
-
191
-
192
-
193
-
194
-
195
-
196
-
197
-
198
-
199
-
200
-
201
-
202
-
203
-
204
-
205
-
206
-
207
-
208
-
209
-
210
-
211
 |
 |

Table of Contents
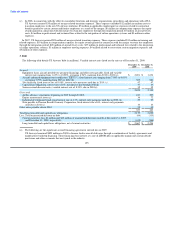
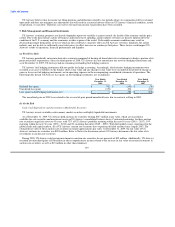
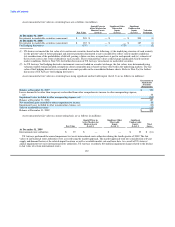
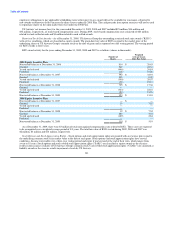
Assets measured at fair value on a recurring basis are as follows (in millions):
Quoted Prices in Significant Other Significant
Active Markets for Observable Unobservable
Identical Assets Inputs Inputs Valuation
Fair Value (Level 1) (Level 2) (Level 3) Technique
At December 31, 2009
Investments in marketable securities (noncurrent) $ 203 $ — $ — $ 203 (1)
At December 31, 2008
Investments in marketable securities (noncurrent) $ 187 $ — $ — $ 187 (1)
Fuel hedging derivatives (375) — (375) — (2)
(1) US Airways estimated the fair value of its auction rate securities based on the following: (i) the underlying structure of each security;
(ii) the present value of future principal and interest payments discounted at rates considered to reflect current market conditions;
(iii) consideration of the probabilities of default, passing a future auction, or repurchase at par for each period; and (iv) estimates of
the recovery rates in the event of default for each security. These estimated fair values could change significantly based on future
market conditions. Refer to Note 5(b) for further discussion of US Airways' investments in marketable securities.
(2) As US Airways' fuel hedging derivative instruments were not traded on a market exchange, the fair values were determined using
valuation models which included assumptions about commodity prices based on those observed in the underlying markets. The fair
value of fuel hedging derivatives is recorded in accounts payable on the consolidated balance sheets. Refer to Note 5(a) for further
discussion of US Airways' fuel hedging derivatives.
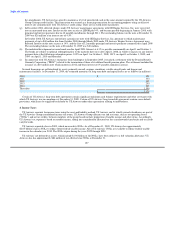
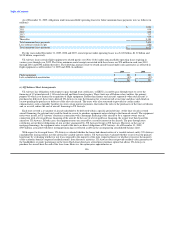
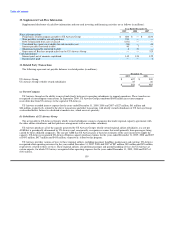
Assets measured at fair value on a recurring basis using significant unobservable inputs (Level 3) are as follows (in millions):
Investments in
Marketable
Securities
(Noncurrent)
Balance at December 31, 2007 $ 353
Losses deemed to be other than temporary reclassified from other comprehensive income to other nonoperating expense,
net 48
Impairment losses included in other nonoperating expense, net (214)
Balance at December 31, 2008 187
Net unrealized gains recorded to other comprehensive income 58
Impairment losses included in other nonoperating expense, net (10)
Sales of marketable securities (32)
Balance at December 31, 2009 $ 203
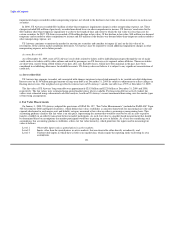
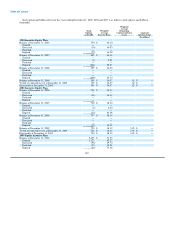
Assets measured at fair value on a nonrecurring basis are as follows (in millions):
Quoted Prices in Significant Other Significant
Active Markets for Observable Unobservable
Identical Assets Inputs Inputs Total
Fair Value (Level 1) (Level 2) (Level 3) Losses
At December 31, 2009
International route authorities $ 39 $ — $ — $ 39 $ (16)
US Airways performed the annual impairment test on its international route authorities during the fourth quarter of 2009. The fair
values of international route authorities were assessed using the market approach. The market approach took into consideration relevant
supply and demand factors at the related airport locations as well as available market sale and lease data. As a result of US Airways'
annual impairment test on its international route authorities, US Airways recorded a $16 million impairment charge related to the decline
in fair value of certain international routes.
132