US Airways 2009 Annual Report Download - page 43
Download and view the complete annual report
Please find page 43 of the 2009 US Airways annual report below. You can navigate through the pages in the report by either clicking on the pages listed below, or by using the keyword search tool below to find specific information within the annual report.-
 1
1 -
2
-
3
-
4
-
5
-
6
-
7
-
8
-
9
-
10
-
11
-
12
-
13
-
14
-
15
-
16
-
17
-
18
-
19
-
20
-
21
-
22
-
23
-
24
-
25
-
26
-
27
-
28
-
29
-
30
-
31
-
32
-
 33
33 -
 34
34 -
 35
35 -
 36
36 -
 37
37 -
 38
38 -
 39
39 -
 40
40 -
 41
41 -
 42
42 -
 43
43 -
 44
44 -
 45
45 -
 46
46 -
 47
47 -
 48
48 -
 49
49 -
 50
50 -
 51
51 -
 52
52 -
 53
53 -
54
-
55
-
56
-
57
-
58
-
59
-
60
-
61
-
62
-
63
-
64
-
65
-
66
-
67
-
68
-
69
-
70
-
71
-
72
-
73
-
74
-
75
-
76
-
77
-
78
-
79
-
80
-
81
-
82
-
83
-
84
-
85
-
86
-
87
-
88
-
89
-
90
-
91
-
92
-
93
-
94
-
95
-
96
-
97
-
98
-
99
-
100
-
101
-
102
-
103
-
104
-
105
-
106
-
107
-
108
-
109
-
110
-
111
-
112
-
113
-
114
-
115
-
116
-
117
-
118
-
119
-
120
-
121
-
122
-
123
-
124
-
125
-
126
-
127
-
128
-
129
-
130
-
131
-
132
-
133
-
134
-
135
-
136
-
137
-
138
-
139
-
140
-
141
-
142
-
143
-
144
-
145
-
146
-
147
-
148
-
149
-
150
-
151
-
152
-
153
-
154
-
155
-
156
-
157
-
158
-
159
-
160
-
161
-
162
-
163
-
164
-
165
-
166
-
167
-
168
-
169
-
170
-
171
-
172
-
173
-
174
-
175
-
176
-
177
-
178
-
179
-
180
-
181
-
182
-
183
-
184
-
185
-
186
-
187
-
188
-
189
-
190
-
191
-
192
-
193
-
194
-
195
-
196
-
197
-
198
-
199
-
200
-
201
-
202
-
203
-
204
-
205
-
206
-
207
-
208
-
209
-
210
-
211
 |
 |

Table of Contents
For the year ended December 31, 2007, we utilized NOLs to reduce our income tax obligation. Utilization of these NOLs resulted in a
corresponding decrease in the valuation allowance. As this valuation allowance was established through the recognition of tax expense,
the decrease in valuation allowance offsets the tax provision dollar for dollar. We recognized $7 million of non-cash state income tax
expense for the year ended December 31, 2007, as we utilized NOLs that were generated by US Airways prior to the merger. As these
were acquired NOLs, the accounting rules in place at that time required that the decrease in the valuation allowance associated with these
NOLs reduce goodwill instead of the provision for income taxes.
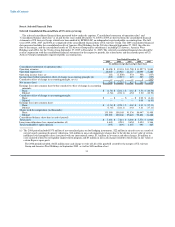
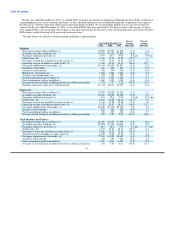
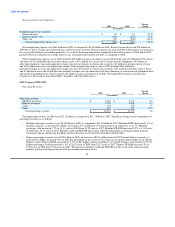
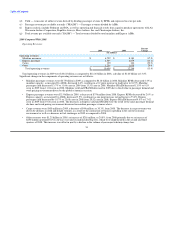
The table below sets forth our selected mainline and Express operating data:
Percent Percent
Year Ended December 31, Change Change
2009 2008 2007 2009-2008 2008-2007
Mainline
Revenue passenger miles (millions) (a) 57,889 60,570 61,262 (4.4) (1.1)
Available seat miles (millions) (b) 70,725 74,151 75,842 (4.6) (2.2)
Passenger load factor (percent) (c) 81.9 81.7 80.8 0.2 pts 0.9 pts
Yield (cents) (d) 11.66 13.51 13.28 (13.7) 1.7
Passenger revenue per available seat mile (cents) (e) 9.55 11.04 10.73 (13.5) 2.9
Operating cost per available seat mile (cents) (f) 11.06 14.66 11.30 (24.6) 29.7
Passenger enplanements (thousands) (g) 51,016 54,820 57,871 (6.9) (5.3)
Departures (thousands) 461 496 525 (7.1) (5.5)
Aircraft at end of period 349 354 356 (1.4) (0.6)
Block hours (thousands) (h) 1,224 1,300 1,343 (5.8) (3.3)
Average stage length (miles) (i) 972 955 925 1.8 3.3
Average passenger journey (miles) (j) 1,637 1,554 1,489 5.4 4.4
Fuel consumption (gallons in millions) 1,069 1,142 1,195 (6.4) (4.4)
Average aircraft fuel price including related taxes (dollars per gallon) 1.74 3.17 2.20 (45.0) 43.9
Full time equivalent employees at end of period 31,333 32,671 34,437 (4.1) (5.1)
Express (k)
Revenue passenger miles (millions) (a) 10,570 10,855 10,332 (2.6) 5.1
Available seat miles (millions) (b) 14,367 14,953 14,159 (3.9) 5.6
Passenger load factor (percent) (c) 73.6 72.6 73.0 1.0 pts (0.4) pts
Yield (cents) (d) 23.68 26.52 26.12 (10.7) 1.6
Passenger revenue per available seat mile (cents) (e) 17.42 19.26 19.06 (9.5) 1.0
Operating cost per available seat mile (cents) (f) 17.53 20.39 18.32 (14.0) 11.3
Passenger enplanements (thousands) (g) 26,949 26,732 25,748 0.8 3.8
Aircraft at end of period 283 296 286 (4.4) 3.5
Fuel consumption (gallons in millions) 338 352 343 (3.8) 2.7
Average aircraft fuel price including related taxes (dollars per gallon) 1.80 3.23 2.23 (44.3) 44.8
Total Mainline and Express
Revenue passenger miles (millions) (a) 68,459 71,425 71,594 (4.2) (0.2)
Available seat miles (millions) (b) 85,092 89,104 90,001 (4.5) (1.0)
Passenger load factor (percent) (c) 80.5 80.2 79.5 0.3 pts 0.7 pts
Yield (cents) (d) 13.52 15.49 15.13 (12.7) 2.4
Passenger revenue per available seat mile (cents) (e) 10.88 12.42 12.04 (12.4) 3.1
Total revenue per available seat mile (cents) (l) 12.29 13.60 13.00 (9.6) 4.6
Passenger enplanements (thousands) (g) 77,965 81,552 83,619 (4.4) (2.5)
Aircraft at end of period 632 650 642 (2.8) 1.2
Fuel consumption (gallons in millions) 1,407 1,494 1,537 (5.8) (2.8)
Average aircraft fuel price including related taxes (dollars per gallon) 1.76 3.18 2.21 (44.8) 44.1
41