US Airways 2009 Annual Report Download - page 100
Download and view the complete annual report
Please find page 100 of the 2009 US Airways annual report below. You can navigate through the pages in the report by either clicking on the pages listed below, or by using the keyword search tool below to find specific information within the annual report.-
 1
1 -
2
-
3
-
4
-
5
-
6
-
7
-
8
-
9
-
10
-
11
-
12
-
13
-
14
-
15
-
16
-
17
-
18
-
19
-
20
-
21
-
22
-
23
-
24
-
25
-
26
-
27
-
28
-
29
-
30
-
31
-
32
-
33
-
34
-
35
-
36
-
37
-
38
-
39
-
40
-
41
-
42
-
43
-
44
-
45
-
46
-
47
-
48
-
49
-
50
-
51
-
52
-
53
-
54
-
55
-
56
-
57
-
58
-
59
-
60
-
61
-
62
-
63
-
64
-
65
-
66
-
67
-
68
-
69
-
70
-
71
-
72
-
73
-
74
-
75
-
76
-
77
-
78
-
79
-
80
-
81
-
82
-
83
-
84
-
85
-
86
-
87
-
88
-
89
-
 90
90 -
 91
91 -
 92
92 -
 93
93 -
 94
94 -
 95
95 -
 96
96 -
 97
97 -
 98
98 -
 99
99 -
 100
100 -
 101
101 -
 102
102 -
 103
103 -
 104
104 -
 105
105 -
 106
106 -
 107
107 -
 108
108 -
 109
109 -
 110
110 -
111
-
112
-
113
-
114
-
115
-
116
-
117
-
118
-
119
-
120
-
121
-
122
-
123
-
124
-
125
-
126
-
127
-
128
-
129
-
130
-
131
-
132
-
133
-
134
-
135
-
136
-
137
-
138
-
139
-
140
-
141
-
142
-
143
-
144
-
145
-
146
-
147
-
148
-
149
-
150
-
151
-
152
-
153
-
154
-
155
-
156
-
157
-
158
-
159
-
160
-
161
-
162
-
163
-
164
-
165
-
166
-
167
-
168
-
169
-
170
-
171
-
172
-
173
-
174
-
175
-
176
-
177
-
178
-
179
-
180
-
181
-
182
-
183
-
184
-
185
-
186
-
187
-
188
-
189
-
190
-
191
-
192
-
193
-
194
-
195
-
196
-
197
-
198
-
199
-
200
-
201
-
202
-
203
-
204
-
205
-
206
-
207
-
208
-
209
-
210
-
211
 |
 |

Table of Contents
$38 million, as of December 31, 2009 and $54 million, $59 million and $33 million, as of December 31, 2008, respectively.
In connection with the ratification of new unified agreements that moved all of US Airways' fleet services and maintenance and related
employees to one labor contract, the Company's postretirement benefit plans were amended effective as of January 1, 2009 to include all
pre-merger AWA fleet service and maintenance and related employees.
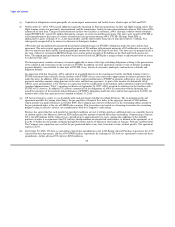
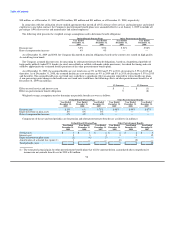
The following table presents the weighted average assumptions used to determine benefit obligations:
Defined Benefit Pension Plans Other Postretirement Benefits
Year Ended Year Ended Year Ended Year Ended
December 31, December 31, December 31, December 31,
2009 2008 2009 2008
Discount rate 5.5% 5.5% 5.51% 5.98%
Rate of compensation increase 4% 4% — —
As of December 31, 2009 and 2008, the Company discounted its pension obligations based on the current rates earned on high quality
Aa rated long-term bonds.
The Company assumed discount rates for measuring its other postretirement benefit obligations, based on a hypothetical portfolio of
high quality publicly traded U.S. bonds (Aa rated, non-callable or callable with make-whole provisions), for which the timing and cash
outflows approximate the estimated benefit payments of the other postretirement benefit plans.
As of December 31, 2009, the assumed health care cost trend rates are 8% in 2010 and 7.5% in 2011, decreasing to 5.5% in 2015 and
thereafter. As of December 31, 2008, the assumed health care cost trend rates are 9% in 2009 and 8% in 2010, decreasing to 5.5% in 2015
and thereafter. The assumed health care cost trend rates could have a significant effect on amounts reported for retiree health care plans.
A one-percentage point change in the health care cost trend rates would have the following effects on other postretirement benefits as of
December 31, 2009 (in millions):
1% Increase 1% Decrease
Effect on total service and interest costs $ 1 $ (1)
Effect on postretirement benefit obligation 9 (8)
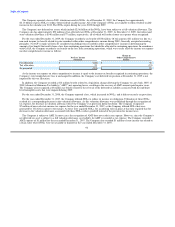
Weighted average assumptions used to determine net periodic benefit cost were as follows:
Defined Benefit Pension Plans Other Postretirement Benefits
Year Ended Year Ended Year Ended Year Ended Year Ended Year Ended
December 31, December 31, December 31, December 31, December 31, December 31,
2009 2008 2007 2009 2008 2007
Discount rate 5.5% 6% 5.75% 5.98% 5.94% 5.67%
Expected return on plan assets 8% 8% 8% — — —
Rate of compensation increase 4% 4% 4% — — —
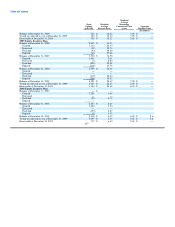
Components of the net and total periodic cost for pension and other postretirement benefits are as follows (in millions):
Defined Benefit Pension Plans Other Postretirement Benefits
Year Ended Year Ended Year Ended Year Ended Year Ended Year Ended
December 31, December 31, December 31, December 31, December 31, December 31,
2009 2008 2007 2009 2008 2007
Service cost $ 1 $ 1 $ 2 $ 2 $ 2 $ 3
Interest cost 3 3 3 9 9 12
Expected return on plan assets (3) (4) (3) — — —
Amortization of actuarial loss (gain) (1) 1 — — (6) (2) —
Total periodic costs $ 2 $ — $ 2 $ 5 $ 9 $ 15
(1) The estimated actuarial gain for other postretirement benefit plans that will be amortized from accumulated other comprehensive
income into net periodic benefit cost in 2010 is $4 million.
98