US Airways 2009 Annual Report Download - page 141
Download and view the complete annual report
Please find page 141 of the 2009 US Airways annual report below. You can navigate through the pages in the report by either clicking on the pages listed below, or by using the keyword search tool below to find specific information within the annual report.-
 1
1 -
2
-
3
-
4
-
5
-
6
-
7
-
8
-
9
-
10
-
11
-
12
-
13
-
14
-
15
-
16
-
17
-
18
-
19
-
20
-
21
-
22
-
23
-
24
-
25
-
26
-
27
-
28
-
29
-
30
-
31
-
32
-
33
-
34
-
35
-
36
-
37
-
38
-
39
-
40
-
41
-
42
-
43
-
44
-
45
-
46
-
47
-
48
-
49
-
50
-
51
-
52
-
53
-
54
-
55
-
56
-
57
-
58
-
59
-
60
-
61
-
62
-
63
-
64
-
65
-
66
-
67
-
68
-
69
-
70
-
71
-
72
-
73
-
74
-
75
-
76
-
77
-
78
-
79
-
80
-
81
-
82
-
83
-
84
-
85
-
86
-
87
-
88
-
89
-
90
-
91
-
92
-
93
-
94
-
95
-
96
-
97
-
98
-
99
-
100
-
101
-
102
-
103
-
104
-
105
-
106
-
107
-
108
-
109
-
110
-
111
-
112
-
113
-
114
-
115
-
116
-
117
-
118
-
119
-
120
-
121
-
122
-
123
-
124
-
125
-
126
-
127
-
128
-
129
-
130
-
 131
131 -
 132
132 -
 133
133 -
 134
134 -
 135
135 -
 136
136 -
 137
137 -
 138
138 -
 139
139 -
 140
140 -
 141
141 -
 142
142 -
 143
143 -
 144
144 -
 145
145 -
 146
146 -
 147
147 -
 148
148 -
 149
149 -
 150
150 -
 151
151 -
152
-
153
-
154
-
155
-
156
-
157
-
158
-
159
-
160
-
161
-
162
-
163
-
164
-
165
-
166
-
167
-
168
-
169
-
170
-
171
-
172
-
173
-
174
-
175
-
176
-
177
-
178
-
179
-
180
-
181
-
182
-
183
-
184
-
185
-
186
-
187
-
188
-
189
-
190
-
191
-
192
-
193
-
194
-
195
-
196
-
197
-
198
-
199
-
200
-
201
-
202
-
203
-
204
-
205
-
206
-
207
-
208
-
209
-
210
-
211
 |
 |

Table of Contents
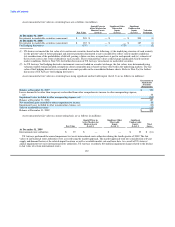
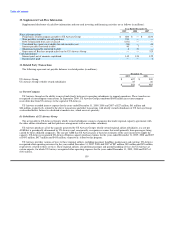
10. Supplemental Cash Flow Information
Supplemental disclosure of cash flow information and non-cash investing and financing activities are as follows (in millions):
Year Ended December 31,
2009 2008 2007
Non-cash transactions:
Forgiveness of intercompany payable to US Airways Group $ 600 $ — $ 1,834
Note payables issued for aircraft purchases 333 — —
Debt extinguished from sale of aircraft (251) — —
Unrealized loss (gain) on available-for-sale securities, net (58) — 48
Interest payable converted to debt 40 7 —
Maintenance payable converted to debt 8 33 —
Repayment of Barclays prepaid miles loan by US Airways Group — — 325
Cash transactions:
Interest paid, net of amounts capitalized 145 124 122
Income taxes paid — — 4
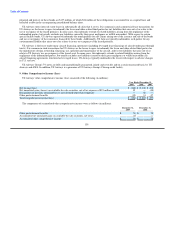
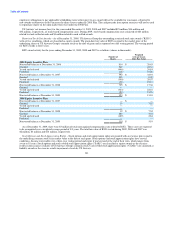
11. Related Party Transactions
The following represents net payable balances to related parties (in millions):
December 31,
2009 2008
US Airways Group $ 607 $ 949
US Airways Group's wholly owned subsidiaries 35 36
$ 642 $ 985
(a) Parent Company
US Airways Group has the ability to move funds freely between its operating subsidiaries to support operations. These transfers are
recognized as intercompany transactions. In September 2009, US Airways Group contributed $600 million in net intercompany
receivables due from US Airways to the capital of US Airways.
US Airways recorded interest expense for the years ended December 31, 2009, 2008 and 2007 of $27 million, $61 million and
$86 million, respectively, related to the above transactions and other transactions with wholly owned subsidiaries of US Airways Group
as described below. Interest is calculated at market rates, which are reset quarterly.
(b) Subsidiaries of US Airways Group
The net payable to US Airways Group's wholly owned subsidiaries consists of amounts due under regional capacity agreements with
the other airline subsidiaries and fuel purchase arrangements with a non-airline subsidiary.
US Airways purchases all of the capacity generated by US Airways Group's wholly owned regional airline subsidiaries at a rate per
ASM that is periodically determined by US Airways and, concurrently, recognizes revenues that result primarily from passengers being
carried by these affiliated companies. The rate per ASM that US Airways pays is based on estimates of the costs incurred to supply the
capacity. US Airways recognized US Airways Express capacity purchase expense for the years ended December 31, 2009, 2008 and 2007
of $451 million, $417 million and $455 million, respectively, related to this program.
US Airways provides various services to these regional airlines, including passenger handling, maintenance and catering. US Airways
recognized other operating revenues for the years ended December 31, 2009, 2008 and 2007 of $87 million, $89 million and $95 million,
respectively, related to these services. These regional airlines also perform passenger and ground handling services for US Airways at
certain airports, for which US Airways recognized other operating expenses for the years ended December 31, 2009, 2008 and 2007 of
$142 million,
139