US Airways 2009 Annual Report Download - page 47
Download and view the complete annual report
Please find page 47 of the 2009 US Airways annual report below. You can navigate through the pages in the report by either clicking on the pages listed below, or by using the keyword search tool below to find specific information within the annual report.-
 1
1 -
2
-
3
-
4
-
5
-
6
-
7
-
8
-
9
-
10
-
11
-
12
-
13
-
14
-
15
-
16
-
17
-
18
-
19
-
20
-
21
-
22
-
23
-
24
-
25
-
26
-
27
-
28
-
29
-
30
-
31
-
32
-
33
-
34
-
35
-
36
-
 37
37 -
 38
38 -
 39
39 -
 40
40 -
 41
41 -
 42
42 -
 43
43 -
 44
44 -
 45
45 -
 46
46 -
 47
47 -
 48
48 -
 49
49 -
 50
50 -
 51
51 -
 52
52 -
 53
53 -
 54
54 -
 55
55 -
 56
56 -
 57
57 -
58
-
59
-
60
-
61
-
62
-
63
-
64
-
65
-
66
-
67
-
68
-
69
-
70
-
71
-
72
-
73
-
74
-
75
-
76
-
77
-
78
-
79
-
80
-
81
-
82
-
83
-
84
-
85
-
86
-
87
-
88
-
89
-
90
-
91
-
92
-
93
-
94
-
95
-
96
-
97
-
98
-
99
-
100
-
101
-
102
-
103
-
104
-
105
-
106
-
107
-
108
-
109
-
110
-
111
-
112
-
113
-
114
-
115
-
116
-
117
-
118
-
119
-
120
-
121
-
122
-
123
-
124
-
125
-
126
-
127
-
128
-
129
-
130
-
131
-
132
-
133
-
134
-
135
-
136
-
137
-
138
-
139
-
140
-
141
-
142
-
143
-
144
-
145
-
146
-
147
-
148
-
149
-
150
-
151
-
152
-
153
-
154
-
155
-
156
-
157
-
158
-
159
-
160
-
161
-
162
-
163
-
164
-
165
-
166
-
167
-
168
-
169
-
170
-
171
-
172
-
173
-
174
-
175
-
176
-
177
-
178
-
179
-
180
-
181
-
182
-
183
-
184
-
185
-
186
-
187
-
188
-
189
-
190
-
191
-
192
-
193
-
194
-
195
-
196
-
197
-
198
-
199
-
200
-
201
-
202
-
203
-
204
-
205
-
206
-
207
-
208
-
209
-
210
-
211
 |
 |

Table of Contents
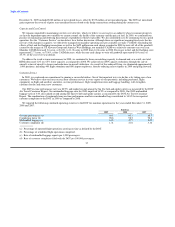
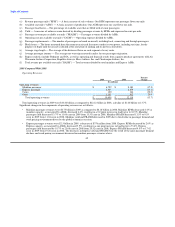
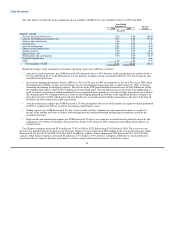
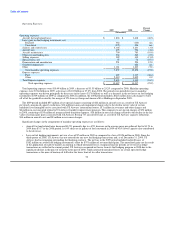
Nonoperating Income (Expense):
Percent
2009 2008 Change
(In millions)
Nonoperating income (expense):
Interest income $ 24 $ 83 (71.5)
Interest expense, net (304) (258) 17.9
Other, net (81) (240) (66.5)
Total nonoperating expense, net $ (361) $ (415) (13.1)
Net nonoperating expense was $361 million in 2009 as compared to $415 million in 2008. Interest income decreased $59 million in
2009 due to lower average investment balances and lower rates of return. Interest expense, net increased $46 million due to an increase in
the average debt balance outstanding primarily as a result of financing transactions completed in the fourth quarter of 2008 and in 2009,
partially offset by reductions in average interest rates associated with variable rate debt as compared to 2008.
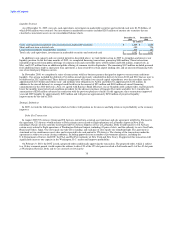
Other nonoperating expense, net in 2009 included $49 million in non-cash charges associated with the sale of 10 Embraer 190 aircraft
and write off of related debt discount and issuance costs, a $14 million loss on the sale of certain aircraft equipment, $10 million in
other-than-temporary non-cash impairment charges for our investments in auction rate securities, $3 million in foreign currency losses
and a $2 million non-cash asset impairment charge. Other nonoperating expense, net in 2008 included $214 million in
other-than-temporary non-cash impairment charges for our investments in auction rate securities, $25 million in foreign currency losses
and $7 million in write offs of debt discount and debt issuance costs in connection with the refinancing of certain aircraft equipment notes
and certain loan prepayments, offset in part by $8 million in gains on forgiveness of debt. The impairment charges on auction rate
securities are discussed in more detail under "Liquidity and Capital Resources."
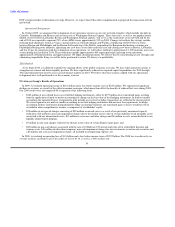
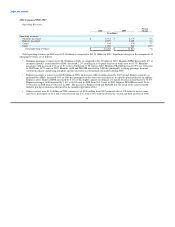
2008 Compared With 2007
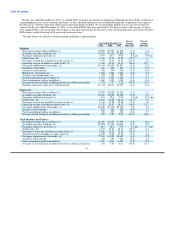
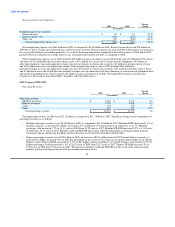
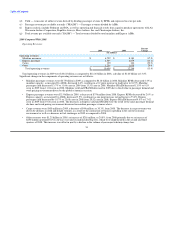
Operating Revenues:
Percent
2008 2007 Change
(In millions)
Operating revenues:
Mainline passenger $ 8,183 $ 8,135 0.6
Express passenger 2,879 2,698 6.7
Cargo 144 138 3.7
Other 912 729 25.3
Total operating revenues $ 12,118 $ 11,700 3.6
Total operating revenues in 2008 were $12.12 billion as compared to $11.7 billion in 2007. Significant changes in the components of
operating revenues are as follows:
• Mainline passenger revenues were $8.18 billion in 2008, as compared to $8.14 billion in 2007. Mainline RPMs decreased 1.1% as
mainline capacity, as measured by ASMs, decreased 2.2%, resulting in a 0.9 point increase in load factor to 81.7%. Mainline
passenger yield increased 1.7% to 13.51 cents in 2008 from 13.28 cents in 2007. Mainline PRASM increased 2.9% to 11.04 cents
in 2008 from 10.73 cents in 2007. Mainline yield and PRASM increased in 2008 due principally to strong passenger demand,
continued capacity and pricing discipline and fare increases in substantially all markets during 2008.
• Express passenger revenues were $2.88 billion in 2008, an increase of $181 million from the 2007 period. Express capacity, as
measured by ASMs, increased 5.6% in 2008 due principally to the year-over-year increase in capacity purchased from an affiliate
Express carrier. Express RPMs increased by 5.1% on this higher capacity resulting in a 0.4 point decrease in load factor to 72.6%.
Express passenger yield increased by 1.6% to 26.52 cents in 2008 from 26.12 cents in 2007. Express PRASM increased 1% to
19.26 cents in 2008 from 19.06 cents in 2007. The increase in Express yield and PRASM was the result of the same favorable
industry pricing environment discussed in the mainline operations above.
45