US Airways 2009 Annual Report Download - page 33
Download and view the complete annual report
Please find page 33 of the 2009 US Airways annual report below. You can navigate through the pages in the report by either clicking on the pages listed below, or by using the keyword search tool below to find specific information within the annual report.-
 1
1 -
2
-
3
-
4
-
5
-
6
-
7
-
8
-
9
-
10
-
11
-
12
-
13
-
14
-
15
-
16
-
17
-
18
-
19
-
20
-
21
-
22
-
 23
23 -
 24
24 -
 25
25 -
 26
26 -
 27
27 -
 28
28 -
 29
29 -
 30
30 -
 31
31 -
 32
32 -
 33
33 -
 34
34 -
 35
35 -
 36
36 -
 37
37 -
 38
38 -
 39
39 -
 40
40 -
 41
41 -
 42
42 -
 43
43 -
44
-
45
-
46
-
47
-
48
-
49
-
50
-
51
-
52
-
53
-
54
-
55
-
56
-
57
-
58
-
59
-
60
-
61
-
62
-
63
-
64
-
65
-
66
-
67
-
68
-
69
-
70
-
71
-
72
-
73
-
74
-
75
-
76
-
77
-
78
-
79
-
80
-
81
-
82
-
83
-
84
-
85
-
86
-
87
-
88
-
89
-
90
-
91
-
92
-
93
-
94
-
95
-
96
-
97
-
98
-
99
-
100
-
101
-
102
-
103
-
104
-
105
-
106
-
107
-
108
-
109
-
110
-
111
-
112
-
113
-
114
-
115
-
116
-
117
-
118
-
119
-
120
-
121
-
122
-
123
-
124
-
125
-
126
-
127
-
128
-
129
-
130
-
131
-
132
-
133
-
134
-
135
-
136
-
137
-
138
-
139
-
140
-
141
-
142
-
143
-
144
-
145
-
146
-
147
-
148
-
149
-
150
-
151
-
152
-
153
-
154
-
155
-
156
-
157
-
158
-
159
-
160
-
161
-
162
-
163
-
164
-
165
-
166
-
167
-
168
-
169
-
170
-
171
-
172
-
173
-
174
-
175
-
176
-
177
-
178
-
179
-
180
-
181
-
182
-
183
-
184
-
185
-
186
-
187
-
188
-
189
-
190
-
191
-
192
-
193
-
194
-
195
-
196
-
197
-
198
-
199
-
200
-
201
-
202
-
203
-
204
-
205
-
206
-
207
-
208
-
209
-
210
-
211
 |
 |

Table of Contents
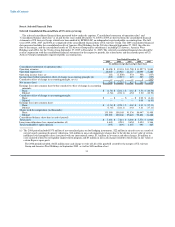
Item 6. Selected Financial Data
Selected Consolidated Financial Data of US Airways Group
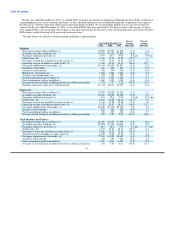
The selected consolidated financial data presented below under the captions "Consolidated statements of operations data" and
"Consolidated balance sheet data" as of and for the years ended December 31, 2005 to 2009 are derived from the consolidated financial
statements of US Airways Group, which have been audited by KPMG LLP, an independent registered public accounting firm. The full
years 2009, 2008, 2007 and 2006 are comprised of the consolidated financial data of US Airways Group. The 2005 consolidated financial
data presented includes the consolidated results of America West Holdings for the 269 days through September 27, 2005, the effective
date of the merger, and the consolidated results of US Airways Group and its subsidiaries, including US Airways, America West
Holdings and AWA, for the 96 days from September 27, 2005 to December 31, 2005. The selected consolidated financial data should be
read in conjunction with the consolidated financial statements for the respective periods, the related notes and the related reports of US
Airways Group's independent registered public accounting firm.
Year Ended December 31,
2009 2008 2007 2006 2005
(In millions except share and per share data)
Consolidated statements of operations data:
Operating revenues $ 10,458 $ 12,118 $ 11,700 $ 11,557 $ 5,069
Operating expenses (a) 10,340 13,918 11,167 10,999 5,286
Operating income (loss) (a) 118 (1,800) 533 558 (217)
Income (loss) before cumulative effect of change in accounting principle (b) (205) (2,215) 423 285 (337)
Cumulative effect of change in accounting principle, net (c) — — — 1 (202)
Net income (loss) $ (205) $ (2,215) $ 423 $ 286 $ (539)
Earnings (loss) per common share before cumulative effect of change in accounting
principle:
Basic $ (1.54) $ (22.11) $ 4.62 $ 3.30 $ (10.70)
Diluted (1.54) (22.11) 4.52 3.20 (10.70)
Cumulative effect of change in accounting principle:
Basic $ — $ — $ — $ 0.01 $ (6.41)
Diluted — — — 0.01 (6.41)
Earnings (loss) per common share:
Basic $ (1.54) $ (22.11) $ 4.62 $ 3.31 $ (17.11)
Diluted (1.54) (22.11) 4.52 3.21 (17.11)
Shares used for computation (in thousands):
Basic 133,000 100,168 91,536 86,447 31,488
Diluted 133,000 100,168 95,603 93,821 31,488
Consolidated balance sheet data (at end of period):
Total assets $ 7,454 $ 7,214 $ 8,040 $ 7,576 $ 6,964
Long-term obligations, less current maturities (d) 4,643 4,281 3,654 3,454 3,366
Total stockholders' equity (deficit) (355) (494) 1,455 990 465
(a) The 2009 period included $375 million of net unrealized gains on fuel hedging instruments, $22 million in aircraft costs as a result of
our previously announced capacity reductions, $16 million in non-cash impairment charges due to the decline in fair value of certain
indefinite lived intangible assets associated with our international routes, $11 million in severance and other charges, $6 million in
costs incurred related to our liquidity improvement program and $3 million in non-cash charges related to the decline in fair value of
certain Express spare parts.
The 2008 period included a $622 million non-cash charge to write off all of the goodwill created by the merger of US Airways
Group and America West Holdings in September 2005, as well as $496 million of net
31