US Airways 2009 Annual Report Download - page 39
Download and view the complete annual report
Please find page 39 of the 2009 US Airways annual report below. You can navigate through the pages in the report by either clicking on the pages listed below, or by using the keyword search tool below to find specific information within the annual report.-
 1
1 -
2
-
3
-
4
-
5
-
6
-
7
-
8
-
9
-
10
-
11
-
12
-
13
-
14
-
15
-
16
-
17
-
18
-
19
-
20
-
21
-
22
-
23
-
24
-
25
-
26
-
27
-
28
-
 29
29 -
 30
30 -
 31
31 -
 32
32 -
 33
33 -
 34
34 -
 35
35 -
 36
36 -
 37
37 -
 38
38 -
 39
39 -
 40
40 -
 41
41 -
 42
42 -
 43
43 -
 44
44 -
 45
45 -
 46
46 -
 47
47 -
 48
48 -
 49
49 -
50
-
51
-
52
-
53
-
54
-
55
-
56
-
57
-
58
-
59
-
60
-
61
-
62
-
63
-
64
-
65
-
66
-
67
-
68
-
69
-
70
-
71
-
72
-
73
-
74
-
75
-
76
-
77
-
78
-
79
-
80
-
81
-
82
-
83
-
84
-
85
-
86
-
87
-
88
-
89
-
90
-
91
-
92
-
93
-
94
-
95
-
96
-
97
-
98
-
99
-
100
-
101
-
102
-
103
-
104
-
105
-
106
-
107
-
108
-
109
-
110
-
111
-
112
-
113
-
114
-
115
-
116
-
117
-
118
-
119
-
120
-
121
-
122
-
123
-
124
-
125
-
126
-
127
-
128
-
129
-
130
-
131
-
132
-
133
-
134
-
135
-
136
-
137
-
138
-
139
-
140
-
141
-
142
-
143
-
144
-
145
-
146
-
147
-
148
-
149
-
150
-
151
-
152
-
153
-
154
-
155
-
156
-
157
-
158
-
159
-
160
-
161
-
162
-
163
-
164
-
165
-
166
-
167
-
168
-
169
-
170
-
171
-
172
-
173
-
174
-
175
-
176
-
177
-
178
-
179
-
180
-
181
-
182
-
183
-
184
-
185
-
186
-
187
-
188
-
189
-
190
-
191
-
192
-
193
-
194
-
195
-
196
-
197
-
198
-
199
-
200
-
201
-
202
-
203
-
204
-
205
-
206
-
207
-
208
-
209
-
210
-
211
 |
 |

Table of Contents
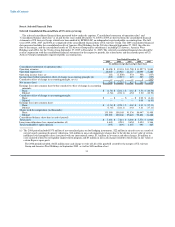
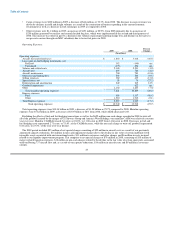
December 31, 2009 included $382 million of net realized losses, offset by $375 million of net unrealized gains. The 2009 net unrealized
gains represent the reversal of prior year unrealized losses related to the hedge transactions settling during the current year.
Capacity and Cost Control
We remain committed to maintaining our low cost structure, which we believe is necessary in an industry whose economic prospects
are heavily dependent upon two variables we cannot control: the health of the economy and the price of fuel. In 2009, we continued our
practice of minimizing and deferring discretionary expenditures whenever possible. We also controlled costs by continuing to run a good
operation. See the "Customer Service" section below for a further discussion. Although there are significant ongoing fixed costs that do
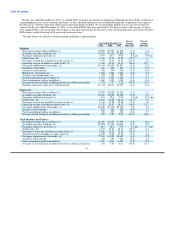
not vary with changes in capacity, we effectively managed our mainline operating cost per available seat mile ("CASM"). Excluding the
effects of fuel and fuel hedging transactions as well as the $622 million non-cash charge recorded in 2008 to write off all of the goodwill
created by the merger of US Airways Group and America West Holdings, our mainline CASM was relatively constant year over year.
Mainline CASM decreased 3.6 cents, or 24.6%, to 11.06 cents in 2009 from 14.66 cents in 2008. Decreases in fuel and fuel hedging costs
represented 2.71 cents, or 75.4%, of the CASM decrease, while the non-cash charge to write off goodwill represented 0.84 cents, or
23.3%, of the year-over-year decline.
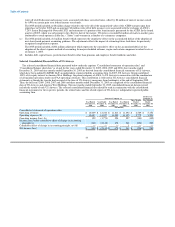
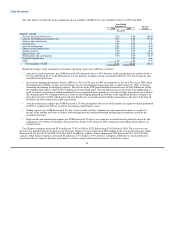
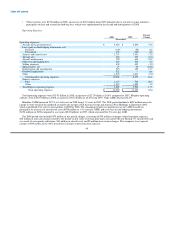
To address the weak revenue environment in 2009, we continued to focus on matching capacity to demand and, as a result, our total
RPMs decreased 4.2% on 4.5% lower capacity as compared to 2008. We achieved our 2009 capacity reductions through the sale of
aircraft, return of aircraft to lessors and reductions in aircraft utilization. As a result of this reduced flying, we eliminated approximately
1,000 positions, including 400 flight attendants and 600 airport employees, thereby reducing salary expense in 2009 and going forward.
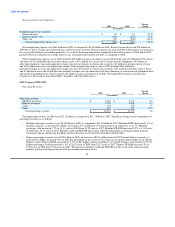
Customer Service
In 2009, we continued our commitment to running a successful airline. One of the important ways we do this is by taking care of our
customers. We believe that our focus on excellent customer service in every aspect of our operations, including personnel, flight
equipment, in-flight and ancillary amenities, on-time performance, flight completion ratios and baggage handling, will strengthen
customer loyalty and attract new customers.
Our 2009 on-time performance rate was 80.9% and ranked second among the big five hub-and-spoke carriers as measured by the DOT
Air Travel Consumer Report. Our mishandled baggage ratio for 2009 improved 36.5% as compared to 2008. Our 2009 mishandled
baggage ratio of 3.03 also ranked second among the big five hub-and-spoke carriers as measured by the DOT Air Travel Consumer
Report. The combination of continued strong on-time performance and fewer mishandled bags contributed to 34.8% fewer reported
customer complaints to the DOT in 2009 as compared to 2008.
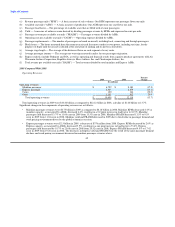
We reported the following combined operating statistics to the DOT for mainline operations for the years ended December 31, 2009,
2008 and 2007:
Full Year
2009 2008 2007
On-time performance (a) 80.9 80.1 68.7
Completion factor (b) 98.8 98.5 98.2
Mishandled baggage (c) 3.03 4.77 8.47
Customer complaints (d) 1.31 2.01 3.16
(a) Percentage of reported flight operations arriving on time as defined by the DOT.
(b) Percentage of scheduled flight operations completed.
(c) Rate of mishandled baggage reports per 1,000 passengers.
(d) Rate of customer complaints filed with the DOT per 100,000 passengers.
37