US Airways 2009 Annual Report Download - page 75
Download and view the complete annual report
Please find page 75 of the 2009 US Airways annual report below. You can navigate through the pages in the report by either clicking on the pages listed below, or by using the keyword search tool below to find specific information within the annual report.-
 1
1 -
2
-
3
-
4
-
5
-
6
-
7
-
8
-
9
-
10
-
11
-
12
-
13
-
14
-
15
-
16
-
17
-
18
-
19
-
20
-
21
-
22
-
23
-
24
-
25
-
26
-
27
-
28
-
29
-
30
-
31
-
32
-
33
-
34
-
35
-
36
-
37
-
38
-
39
-
40
-
41
-
42
-
43
-
44
-
45
-
46
-
47
-
48
-
49
-
50
-
51
-
52
-
53
-
54
-
55
-
56
-
57
-
58
-
59
-
60
-
61
-
62
-
63
-
64
-
 65
65 -
 66
66 -
 67
67 -
 68
68 -
 69
69 -
 70
70 -
 71
71 -
 72
72 -
 73
73 -
 74
74 -
 75
75 -
 76
76 -
 77
77 -
 78
78 -
 79
79 -
 80
80 -
 81
81 -
 82
82 -
 83
83 -
 84
84 -
 85
85 -
86
-
87
-
88
-
89
-
90
-
91
-
92
-
93
-
94
-
95
-
96
-
97
-
98
-
99
-
100
-
101
-
102
-
103
-
104
-
105
-
106
-
107
-
108
-
109
-
110
-
111
-
112
-
113
-
114
-
115
-
116
-
117
-
118
-
119
-
120
-
121
-
122
-
123
-
124
-
125
-
126
-
127
-
128
-
129
-
130
-
131
-
132
-
133
-
134
-
135
-
136
-
137
-
138
-
139
-
140
-
141
-
142
-
143
-
144
-
145
-
146
-
147
-
148
-
149
-
150
-
151
-
152
-
153
-
154
-
155
-
156
-
157
-
158
-
159
-
160
-
161
-
162
-
163
-
164
-
165
-
166
-
167
-
168
-
169
-
170
-
171
-
172
-
173
-
174
-
175
-
176
-
177
-
178
-
179
-
180
-
181
-
182
-
183
-
184
-
185
-
186
-
187
-
188
-
189
-
190
-
191
-
192
-
193
-
194
-
195
-
196
-
197
-
198
-
199
-
200
-
201
-
202
-
203
-
204
-
205
-
206
-
207
-
208
-
209
-
210
-
211
 |
 |

Table of Contents
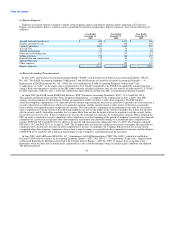
US Airways Group, Inc.
Consolidated Statements of Operations
For the Years Ended December 31, 2009, 2008 and 2007
2009 2008 2007
(In millions, except share and per share amounts)
Operating revenues:
Mainline passenger $ 6,752 $ 8,183 $ 8,135
Express passenger 2,503 2,879 2,698
Cargo 100 144 138
Other 1,103 912 729
Total operating revenues 10,458 12,118 11,700
Operating expenses:
Aircraft fuel and related taxes 1,863 3,618 2,630
Loss (gain) on fuel hedging instruments, net 7 356 (245)
Salaries and related costs 2,165 2,231 2,302
Express expenses 2,519 3,049 2,594
Aircraft rent 695 724 727
Aircraft maintenance 700 783 635
Other rent and landing fees 560 562 536
Selling expenses 382 439 453
Special items, net 55 76 99
Depreciation and amortization 242 215 189
Goodwill impairment — 622 —
Other 1,152 1,243 1,247
Total operating expenses 10,340 13,918 11,167
Operating income (loss) 118 (1,800) 533
Nonoperating income (expense):
Interest income 24 83 172
Interest expense, net (304) (258) (277)
Other, net (81) (240) 2
Total nonoperating expense, net (361) (415) (103)
Income (loss) before income taxes (243) (2,215) 430
Income tax provision (benefit) (38) — 7
Net income (loss) $ (205) $ (2,215) $ 423
Earnings (loss) per common share:
Basic earnings (loss) per share $ (1.54) $ (22.11) $ 4.62
Diluted earnings (loss) per share $ (1.54) $ (22.11) $ 4.52
Shares used for computation (in thousands):
Basic 133,000 100,168 91,536
Diluted 133,000 100,168 95,603
See accompanying notes to consolidated financial statements.
73