US Airways 2009 Annual Report Download - page 37
Download and view the complete annual report
Please find page 37 of the 2009 US Airways annual report below. You can navigate through the pages in the report by either clicking on the pages listed below, or by using the keyword search tool below to find specific information within the annual report.-
 1
1 -
2
-
3
-
4
-
5
-
6
-
7
-
8
-
9
-
10
-
11
-
12
-
13
-
14
-
15
-
16
-
17
-
18
-
19
-
20
-
21
-
22
-
23
-
24
-
25
-
26
-
 27
27 -
 28
28 -
 29
29 -
 30
30 -
 31
31 -
 32
32 -
 33
33 -
 34
34 -
 35
35 -
 36
36 -
 37
37 -
 38
38 -
 39
39 -
 40
40 -
 41
41 -
 42
42 -
 43
43 -
 44
44 -
 45
45 -
 46
46 -
 47
47 -
48
-
49
-
50
-
51
-
52
-
53
-
54
-
55
-
56
-
57
-
58
-
59
-
60
-
61
-
62
-
63
-
64
-
65
-
66
-
67
-
68
-
69
-
70
-
71
-
72
-
73
-
74
-
75
-
76
-
77
-
78
-
79
-
80
-
81
-
82
-
83
-
84
-
85
-
86
-
87
-
88
-
89
-
90
-
91
-
92
-
93
-
94
-
95
-
96
-
97
-
98
-
99
-
100
-
101
-
102
-
103
-
104
-
105
-
106
-
107
-
108
-
109
-
110
-
111
-
112
-
113
-
114
-
115
-
116
-
117
-
118
-
119
-
120
-
121
-
122
-
123
-
124
-
125
-
126
-
127
-
128
-
129
-
130
-
131
-
132
-
133
-
134
-
135
-
136
-
137
-
138
-
139
-
140
-
141
-
142
-
143
-
144
-
145
-
146
-
147
-
148
-
149
-
150
-
151
-
152
-
153
-
154
-
155
-
156
-
157
-
158
-
159
-
160
-
161
-
162
-
163
-
164
-
165
-
166
-
167
-
168
-
169
-
170
-
171
-
172
-
173
-
174
-
175
-
176
-
177
-
178
-
179
-
180
-
181
-
182
-
183
-
184
-
185
-
186
-
187
-
188
-
189
-
190
-
191
-
192
-
193
-
194
-
195
-
196
-
197
-
198
-
199
-
200
-
201
-
202
-
203
-
204
-
205
-
206
-
207
-
208
-
209
-
210
-
211
 |
 |

Table of Contents
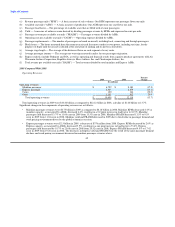
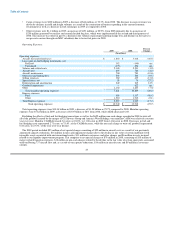
issuance costs in connection with the refinancing of certain aircraft equipment notes and a loan prepayment, offset by $8 million in
gains on forgiveness of debt.
The 2007 period included a $17 million gain recognized on the sale of stock in ARINC Incorporated, offset by $10 million in
other-than-temporary non-cash impairment charges for US Airways' investments in auction rate securities. In addition, the period
also included a non-cash expense for income taxes of $7 million related to the utilization of NOLs that were generated prior to the
merger. The decrease in the corresponding valuation allowance was recognized as a reduction of goodwill rather than a reduction in
tax expense.
The 2006 period included a non-cash expense for income taxes of $85 million related to the utilization of NOLs that were generated
prior to the merger. In addition, the period included $6 million of prepayment penalties and $5 million in accelerated amortization of
debt issuance costs in connection with the refinancing of the loan previously guaranteed by the ATSB and two loans previously
provided to AWA by GECC, offset by $8 million of interest income earned by AWA on certain prior year federal income tax
refunds.
The period for the three months ended December 31, 2005 included an $8 million charge related to the write off of the unamortized
value of the ATSB warrants upon their repurchase in October 2005 and an aggregate $2 million write off of debt issuance costs
associated with the exchange of AWA's 7.25% Senior Exchangeable Notes due 2023 and retirement of a portion of the loan formerly
guaranteed by the ATSB. US Airways also recorded in this period $4 million of mark-to-market gains attributable to stock options in
Sabre and warrants in a number of e-commerce companies.
The nine months ended September 30, 2005 included reorganization items, which amounted to a $636 million net gain.
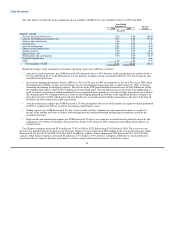
(d) The 2006 period included a $1 million benefit which represents the cumulative effect on the accumulated deficit of the adoption of
new share-based payment accounting guidance. The adjustment reflects the impact of estimating future forfeitures for previously
recognized compensation expense.
(e) Includes debt, capital leases, postretirement benefits other than pensions and employee benefit liabilities and other.
Item 7. Management's Discussion and Analysis of Financial Condition and Results of Operations
Background
US Airways Group is a holding company whose primary business activity is the operation of a major network air carrier through its
wholly owned subsidiaries US Airways, Piedmont, PSA, MSC and AAL. Effective upon US Airways Group's emergence from
bankruptcy on September 27, 2005, US Airways Group merged with America West Holdings, with US Airways Group as the surviving
corporation.
We operate the fifth largest airline in the United States as measured by domestic RPMs and ASMs. We have hubs in Charlotte,
Philadelphia and Phoenix and a focus city at Ronald Reagan Washington National Airport. We offer scheduled passenger service on more
than 3,000 flights daily to more than 190 communities in the United States, Canada, Mexico, Europe, the Middle East, the Caribbean,
Central and South America. We also have an established East Coast route network, including the US Airways Shuttle service, with a
substantial presence at Washington National Airport. We had approximately 51 million passengers boarding our mainline flights in 2009.
As of December 31, 2009, we operated 349 mainline jets and are supported by our regional airline subsidiaries and affiliates operating as
US Airways Express either under capacity purchase or prorate agreements, which operated approximately 236 regional jets and 60
turboprops.
2009 Year in Review
The U.S. Airline Industry
The airline industry in the United States was severely impacted in 2009 by the global economic recession. Passenger demand, as
reported by the Air Transport Association ("ATA"), declined severely in 2009 as compared to 2008. Despite capacity cuts put in place to
help offset the decline in demand for air travel, industry revenues were adversely affected by severe fare discounting by carriers to
stimulate demand. Business bookings, which typically drive stronger yields, declined sharply in 2009 as companies cut costs by reducing
their travel budgets in response to
35