US Airways 2009 Annual Report Download - page 80
Download and view the complete annual report
Please find page 80 of the 2009 US Airways annual report below. You can navigate through the pages in the report by either clicking on the pages listed below, or by using the keyword search tool below to find specific information within the annual report.-
 1
1 -
2
-
3
-
4
-
5
-
6
-
7
-
8
-
9
-
10
-
11
-
12
-
13
-
14
-
15
-
16
-
17
-
18
-
19
-
20
-
21
-
22
-
23
-
24
-
25
-
26
-
27
-
28
-
29
-
30
-
31
-
32
-
33
-
34
-
35
-
36
-
37
-
38
-
39
-
40
-
41
-
42
-
43
-
44
-
45
-
46
-
47
-
48
-
49
-
50
-
51
-
52
-
53
-
54
-
55
-
56
-
57
-
58
-
59
-
60
-
61
-
62
-
63
-
64
-
65
-
66
-
67
-
68
-
69
-
 70
70 -
 71
71 -
 72
72 -
 73
73 -
 74
74 -
 75
75 -
 76
76 -
 77
77 -
 78
78 -
 79
79 -
 80
80 -
 81
81 -
 82
82 -
 83
83 -
 84
84 -
 85
85 -
 86
86 -
 87
87 -
 88
88 -
 89
89 -
 90
90 -
91
-
92
-
93
-
94
-
95
-
96
-
97
-
98
-
99
-
100
-
101
-
102
-
103
-
104
-
105
-
106
-
107
-
108
-
109
-
110
-
111
-
112
-
113
-
114
-
115
-
116
-
117
-
118
-
119
-
120
-
121
-
122
-
123
-
124
-
125
-
126
-
127
-
128
-
129
-
130
-
131
-
132
-
133
-
134
-
135
-
136
-
137
-
138
-
139
-
140
-
141
-
142
-
143
-
144
-
145
-
146
-
147
-
148
-
149
-
150
-
151
-
152
-
153
-
154
-
155
-
156
-
157
-
158
-
159
-
160
-
161
-
162
-
163
-
164
-
165
-
166
-
167
-
168
-
169
-
170
-
171
-
172
-
173
-
174
-
175
-
176
-
177
-
178
-
179
-
180
-
181
-
182
-
183
-
184
-
185
-
186
-
187
-
188
-
189
-
190
-
191
-
192
-
193
-
194
-
195
-
196
-
197
-
198
-
199
-
200
-
201
-
202
-
203
-
204
-
205
-
206
-
207
-
208
-
209
-
210
-
211
 |
 |

Table of Contents
equivalents are stated at cost, which approximates fair value due to the highly liquid nature and short-term maturities of the underlying
securities.
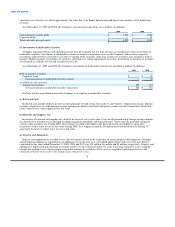
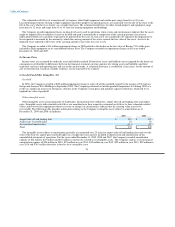
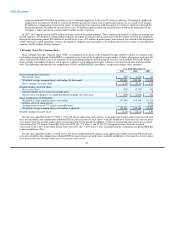
As of December 31, 2009 and 2008, the Company's cash and cash equivalents are as follows (in millions):
2009 2008
Cash and money market funds $ 1,299 $ 1,024
Corporate bonds — 10
Total cash and cash equivalents $ 1,299 $ 1,034
(d) Investments in Marketable Securities
All highly liquid investments with maturities greater than three months but less than one year are classified as current investments in
marketable securities. Investments in marketable securities classified as noncurrent assets on the Company's balance sheet represent
investments expected to be converted to cash after 12 months. Debt securities, other than auction rate securities, are classified as held to
maturity. Held-to-maturity investments are carried at amortized cost, which approximates fair value. Investments in auction rate securities
are classified as available for sale and recorded at fair value.
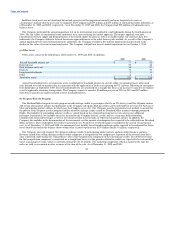
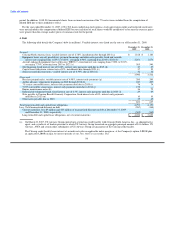
As of December 31, 2009 and 2008, the Company's investments in marketable securities are classified as follows (in millions):
2009 2008
Held-to-maturity securities:
Corporate bonds $ — $ 20
Total investments in marketable securities-current — 20
Available-for-sale securities:
Auction rate securities 203 187
Total investments in marketable securities-noncurrent $ 203 $ 187
See Note 6(b) for more information on the Company's investments in marketable securities.
(e) Restricted Cash
Restricted cash includes deposits in trust accounts primarily to fund certain taxes and fees and workers' compensation claims, deposits
securing certain letters of credit and surety bonds and deposits held by institutions that process credit card sales transactions. Restricted
cash is stated at cost, which approximates fair value.
(f) Materials and Supplies, Net
Inventories of materials and supplies are valued at the lower of cost or fair value. Costs are determined using average costing methods.
An allowance for obsolescence is provided for flight equipment expendable and repairable parts. These items are generally charged to
expense when issued for use. During 2009, the Company recorded a $3 million write down related to certain Express spare parts
inventory to reflect lower of cost or fair value. During 2008, the Company recorded a $5 million write down related to its Boeing 737
spare parts inventory to reflect lower of cost or fair value.
(g) Property and Equipment
Property and equipment are recorded at cost. Interest expense related to the acquisition of certain property and equipment, including
aircraft purchase deposits, is capitalized as an additional cost of the asset or as a leasehold improvement if the asset is leased. Interest
capitalized for the years ended December 31, 2009, 2008 and 2007 was $10 million, $6 million and $4 million, respectively. Property and
equipment is depreciated and amortized to residual values over the estimated useful lives or the lease term, whichever is less, using the
straight-line method. Costs of major improvements that enhance the usefulness of the asset are capitalized and depreciated over the
estimated useful life of the asset or the modifications, whichever is less.
78