US Airways 2009 Annual Report Download - page 15
Download and view the complete annual report
Please find page 15 of the 2009 US Airways annual report below. You can navigate through the pages in the report by either clicking on the pages listed below, or by using the keyword search tool below to find specific information within the annual report.-
 1
1 -
2
-
3
-
4
-
 5
5 -
 6
6 -
 7
7 -
 8
8 -
 9
9 -
 10
10 -
 11
11 -
 12
12 -
 13
13 -
 14
14 -
 15
15 -
 16
16 -
 17
17 -
 18
18 -
 19
19 -
 20
20 -
 21
21 -
 22
22 -
 23
23 -
 24
24 -
 25
25 -
26
-
27
-
28
-
29
-
30
-
31
-
32
-
33
-
34
-
35
-
36
-
37
-
38
-
39
-
40
-
41
-
42
-
43
-
44
-
45
-
46
-
47
-
48
-
49
-
50
-
51
-
52
-
53
-
54
-
55
-
56
-
57
-
58
-
59
-
60
-
61
-
62
-
63
-
64
-
65
-
66
-
67
-
68
-
69
-
70
-
71
-
72
-
73
-
74
-
75
-
76
-
77
-
78
-
79
-
80
-
81
-
82
-
83
-
84
-
85
-
86
-
87
-
88
-
89
-
90
-
91
-
92
-
93
-
94
-
95
-
96
-
97
-
98
-
99
-
100
-
101
-
102
-
103
-
104
-
105
-
106
-
107
-
108
-
109
-
110
-
111
-
112
-
113
-
114
-
115
-
116
-
117
-
118
-
119
-
120
-
121
-
122
-
123
-
124
-
125
-
126
-
127
-
128
-
129
-
130
-
131
-
132
-
133
-
134
-
135
-
136
-
137
-
138
-
139
-
140
-
141
-
142
-
143
-
144
-
145
-
146
-
147
-
148
-
149
-
150
-
151
-
152
-
153
-
154
-
155
-
156
-
157
-
158
-
159
-
160
-
161
-
162
-
163
-
164
-
165
-
166
-
167
-
168
-
169
-
170
-
171
-
172
-
173
-
174
-
175
-
176
-
177
-
178
-
179
-
180
-
181
-
182
-
183
-
184
-
185
-
186
-
187
-
188
-
189
-
190
-
191
-
192
-
193
-
194
-
195
-
196
-
197
-
198
-
199
-
200
-
201
-
202
-
203
-
204
-
205
-
206
-
207
-
208
-
209
-
210
-
211
 |
 |

Table of Contents
work under the terms of their separate US Airways and AWA collective bargaining agreements, as modified by the transition
agreements reached in connection with the merger.
On April 18, 2008, the NMB certified USAPA as the collective bargaining representative for the pilots of the combined company,
including pilot groups from both pre-merger AWA and US Airways. Since that time, we have been engaged in negotiations with USAPA
over the terms of a single labor agreement covering both groups. In the meantime, while those negotiations are underway, each of the
pilot groups continues to be covered by the USAPA collective bargaining agreements referenced above.
There are few remaining unrepresented employee groups that could engage in organization efforts. We cannot predict the outcome of
any future efforts to organize those remaining employees or the terms of any future labor agreements or the effect, if any, on US Airways'
operations or financial performance. For more discussion, see Part I, Item 1A, "Risk Factors – Union disputes, employee strikes and other
labor-related disruptions may adversely affect our operations."
Aviation Fuel
The average cost of a gallon of aviation fuel for our mainline and Express operations decreased 44.8% from 2008 to 2009, and our
total mainline and Express fuel expense decreased $2.28 billion, or 48%, from 2008 to 2009. We estimate that a one cent per gallon
increase in aviation fuel prices would result in a $14 million increase in annual fuel expense based on our 2010 forecasted mainline and
Express fuel consumption.
Since the third quarter of 2008, we have not entered into any new fuel hedging transactions and, as of December 31, 2009, we had no
remaining outstanding fuel hedging contracts. During 2009, 2008 and 2007, we recognized a net loss of $7 million, a net loss of
$356 million and a net gain of $245 million, respectively, related to our fuel hedging program.
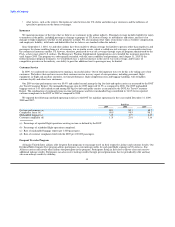
The following table shows annual aircraft fuel consumption and costs for our mainline operations for 2007 through 2009 (gallons and
aircraft fuel expense in millions):
Average Price Aircraft Fuel Percentage of Total
Year Gallons per Gallon (1) Expense (1) Operating Expenses
2009 1,069 $ 1.74 $ 1,863 23.8%
2008 1,142 3.17 3,618 33.3%
2007 1,195 2.20 2,630 30.7%
(1) Includes fuel taxes and excludes the impact of fuel hedges. The impact of fuel hedges is described in Part II, Item 7 under "US
Airways Group's Results of Operations" and "US Airways' Results of Operations."
In addition, we incur fuel expenses related to our Express operations. Total fuel expenses for US Airways Group's wholly owned
regional airlines and affiliate regional airlines operating under capacity purchase agreements as US Airways Express for the years ended
December 31, 2009, 2008 and 2007 were $609 million, $1.14 billion and $765 million, respectively.
Prices and availability of all petroleum products are subject to political, economic and market factors that are generally outside of our
control. Accordingly, the price and availability of aviation fuel, as well as other petroleum products, can be unpredictable. Prices and
availability may be affected by many factors, including:
• the impact of global political instability on crude oil production;
• unexpected changes to the availability of petroleum products due to disruptions in distribution systems or refineries, as evidenced
in the third quarter of 2005 when Hurricane Katrina and Hurricane Rita caused widespread disruption to oil production, refinery
operations and pipeline capacity along certain portions of the U.S. Gulf Coast;
• unpredictable increases to crude oil demand due to weather or the pace of economic growth;
• inventory levels of crude oil, refined products and natural gas; and
13