US Airways 2009 Annual Report Download - page 145
Download and view the complete annual report
Please find page 145 of the 2009 US Airways annual report below. You can navigate through the pages in the report by either clicking on the pages listed below, or by using the keyword search tool below to find specific information within the annual report.-
 1
1 -
2
-
3
-
4
-
5
-
6
-
7
-
8
-
9
-
10
-
11
-
12
-
13
-
14
-
15
-
16
-
17
-
18
-
19
-
20
-
21
-
22
-
23
-
24
-
25
-
26
-
27
-
28
-
29
-
30
-
31
-
32
-
33
-
34
-
35
-
36
-
37
-
38
-
39
-
40
-
41
-
42
-
43
-
44
-
45
-
46
-
47
-
48
-
49
-
50
-
51
-
52
-
53
-
54
-
55
-
56
-
57
-
58
-
59
-
60
-
61
-
62
-
63
-
64
-
65
-
66
-
67
-
68
-
69
-
70
-
71
-
72
-
73
-
74
-
75
-
76
-
77
-
78
-
79
-
80
-
81
-
82
-
83
-
84
-
85
-
86
-
87
-
88
-
89
-
90
-
91
-
92
-
93
-
94
-
95
-
96
-
97
-
98
-
99
-
100
-
101
-
102
-
103
-
104
-
105
-
106
-
107
-
108
-
109
-
110
-
111
-
112
-
113
-
114
-
115
-
116
-
117
-
118
-
119
-
120
-
121
-
122
-
123
-
124
-
125
-
126
-
127
-
128
-
129
-
130
-
131
-
132
-
133
-
134
-
 135
135 -
 136
136 -
 137
137 -
 138
138 -
 139
139 -
 140
140 -
 141
141 -
 142
142 -
 143
143 -
 144
144 -
 145
145 -
 146
146 -
 147
147 -
 148
148 -
 149
149 -
 150
150 -
 151
151 -
 152
152 -
 153
153 -
 154
154 -
 155
155 -
156
-
157
-
158
-
159
-
160
-
161
-
162
-
163
-
164
-
165
-
166
-
167
-
168
-
169
-
170
-
171
-
172
-
173
-
174
-
175
-
176
-
177
-
178
-
179
-
180
-
181
-
182
-
183
-
184
-
185
-
186
-
187
-
188
-
189
-
190
-
191
-
192
-
193
-
194
-
195
-
196
-
197
-
198
-
199
-
200
-
201
-
202
-
203
-
204
-
205
-
206
-
207
-
208
-
209
-
210
-
211
 |
 |
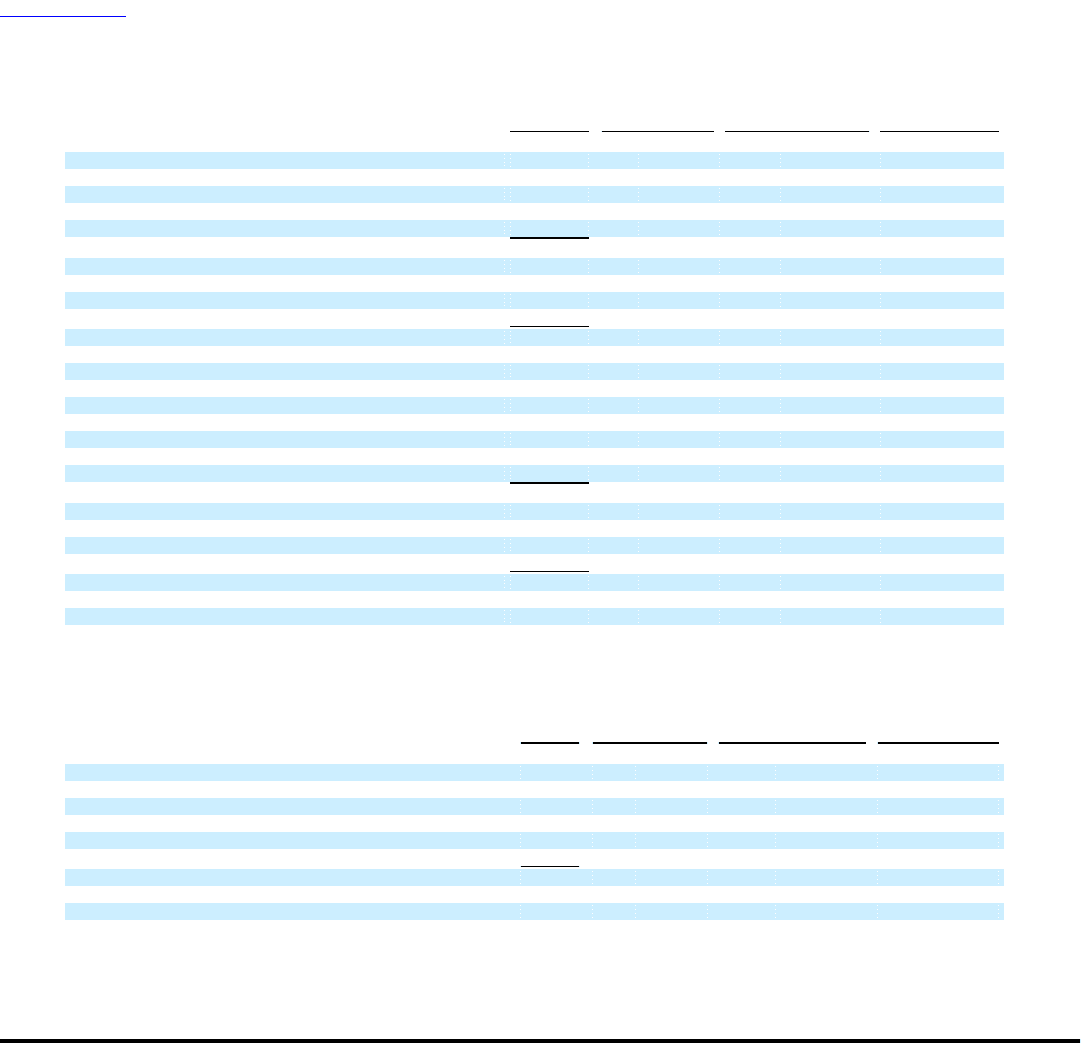
Table of Contents
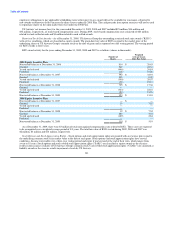
Weighted
Average
Stock Weighted Remaining
Options Average Contractual Term Aggregate
and SARs Exercise Price (years) Intrinsic Value
(In millions)
Balance at December 31, 2007 3,370 $ 34.96
Granted 1,959 9.11
Exercised (5) 8.84
Forfeited (200) 30.18
Expired (218) 32.76
Balance at December 31, 2008 4,906 $ 24.93
Granted — —
Exercised — —
Forfeited (119) 20.43
Expired (266) 30.82
Balance at December 31, 2009 4,521 $ 24.67 7.00 $ —
Vested or expected to vest at December 31, 2009 4,429 $ 24.87 6.98 $ —
Exercisable at December 31, 2009 3,184 $ 28.69 6.54 $ —
2008 Equity Incentive Plan
Balance at December 31, 2007 — $ —
Granted 2,389 6.64
Exercised — —
Forfeited (56) 6.70
Expired — —
Balance at December 31, 2008 2,333 $ 6.64
Granted 3,286 3.23
Exercised — —
Forfeited (193) 6.67
Expired (8) 6.70
Balance at December 31, 2009 5,418 $ 4.57 6.03 $ 5.6
Vested or expected to vest at December 31, 2009 5,095 $ 4.59 6.02 $ 5.2
Exercisable at December 31, 2009 717 $ 6.65 5.63 $ —
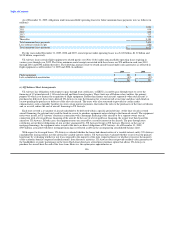
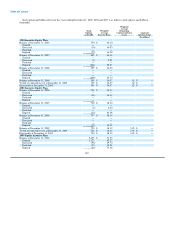
CSARs activity for the year ending December 31, 2009 is as follows (CSARs in thousands):
Weighted
Average
Weighted Remaining
Average Contractual Term Aggregate
CSARs Exercise Price (years) Intrinsic Value
(In millions)
2008 Equity Incentive Plan
Balance at December 31, 2008 — $ —
Granted 4,645 3.10
Exercised — —
Forfeited (232) 3.10
Expired — —
Balance at December 31, 2009 4,413 $ 3.10 6.27 $ 7.7
Vested or expected to vest at December 31, 2009 4,110 $ 3.10 6.27 $ 7.2
Exercisable at December 31, 2009 3 $ 5.23 5.87 $ —
The fair value of stock options and stock appreciation rights is determined at the grant date using a Black-Scholes option pricing
model, which requires several assumptions. The risk-free interest rate is based on the U.S. Treasury yield curve in effect for the expected
term of the award at the time of grant. The dividend yield is assumed to be zero as US Airways Group does not pay dividends and has no
current plans to do so in the future. The volatility is based 143