US Airways 2009 Annual Report Download - page 109
Download and view the complete annual report
Please find page 109 of the 2009 US Airways annual report below. You can navigate through the pages in the report by either clicking on the pages listed below, or by using the keyword search tool below to find specific information within the annual report.-
 1
1 -
2
-
3
-
4
-
5
-
6
-
7
-
8
-
9
-
10
-
11
-
12
-
13
-
14
-
15
-
16
-
17
-
18
-
19
-
20
-
21
-
22
-
23
-
24
-
25
-
26
-
27
-
28
-
29
-
30
-
31
-
32
-
33
-
34
-
35
-
36
-
37
-
38
-
39
-
40
-
41
-
42
-
43
-
44
-
45
-
46
-
47
-
48
-
49
-
50
-
51
-
52
-
53
-
54
-
55
-
56
-
57
-
58
-
59
-
60
-
61
-
62
-
63
-
64
-
65
-
66
-
67
-
68
-
69
-
70
-
71
-
72
-
73
-
74
-
75
-
76
-
77
-
78
-
79
-
80
-
81
-
82
-
83
-
84
-
85
-
86
-
87
-
88
-
89
-
90
-
91
-
92
-
93
-
94
-
95
-
96
-
97
-
98
-
 99
99 -
 100
100 -
 101
101 -
 102
102 -
 103
103 -
 104
104 -
 105
105 -
 106
106 -
 107
107 -
 108
108 -
 109
109 -
 110
110 -
 111
111 -
 112
112 -
 113
113 -
 114
114 -
 115
115 -
 116
116 -
 117
117 -
 118
118 -
 119
119 -
120
-
121
-
122
-
123
-
124
-
125
-
126
-
127
-
128
-
129
-
130
-
131
-
132
-
133
-
134
-
135
-
136
-
137
-
138
-
139
-
140
-
141
-
142
-
143
-
144
-
145
-
146
-
147
-
148
-
149
-
150
-
151
-
152
-
153
-
154
-
155
-
156
-
157
-
158
-
159
-
160
-
161
-
162
-
163
-
164
-
165
-
166
-
167
-
168
-
169
-
170
-
171
-
172
-
173
-
174
-
175
-
176
-
177
-
178
-
179
-
180
-
181
-
182
-
183
-
184
-
185
-
186
-
187
-
188
-
189
-
190
-
191
-
192
-
193
-
194
-
195
-
196
-
197
-
198
-
199
-
200
-
201
-
202
-
203
-
204
-
205
-
206
-
207
-
208
-
209
-
210
-
211
 |
 |
Table of Contents
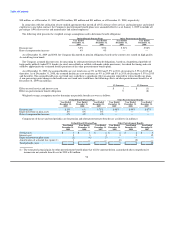
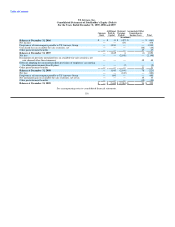
Weighted
Average
Stock Weighted Remaining
Options Average Contractual Term Aggregate
and SARs Exercise Price (years) Intrinsic Value
(In millions)
Balance at December 31, 2009 720 $ 18.32 3.95 $ —
Vested or expected to vest at December 31, 2009 720 $ 18.32 3.95 $ —
Exercisable at December 31, 2009 720 $ 18.32 3.95 $ —
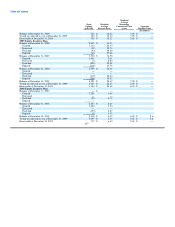
2005 Equity Incentive Plan
Balance at December 31, 2006 2,495 $ 31.53
Granted 1,123 42.23
Exercised (92) 29.74
Forfeited (93) 35.00
Expired (63) 37.48
Balance at December 31, 2007 3,370 $ 34.96
Granted 1,959 9.11
Exercised (5) 8.84
Forfeited (200) 30.18
Expired (218) 32.76
Balance at December 31, 2008 4,906 $ 24.93
Granted — —
Exercised — —
Forfeited (119) 20.43
Expired (266) 30.82
Balance at December 31, 2009 4,521 $ 24.67 7.00 $ —
Vested or expected to vest at December 31, 2009 4,429 $ 24.87 6.98 $ —
Exercisable at December 31, 2009 3,184 $ 28.69 6.54 $ —
2008 Equity Incentive Plan
Balance at December 31, 2007 — $ —
Granted 2,389 6.64
Exercised — —
Forfeited (56) 6.70
Expired — —
Balance at December 31, 2008 2,333 $ 6.64
Granted 3,286 3.23
Exercised — —
Forfeited (193) 6.67
Expired (8) 6.70
Balance at December 31, 2009 5,418 $ 4.57 6.03 $ 5.6
Vested or expected to vest at December 31, 2009 5,095 $ 4.59 6.02 $ 5.2
Exercisable at December 31, 2009 717 $ 6.65 5.63 $ —
107